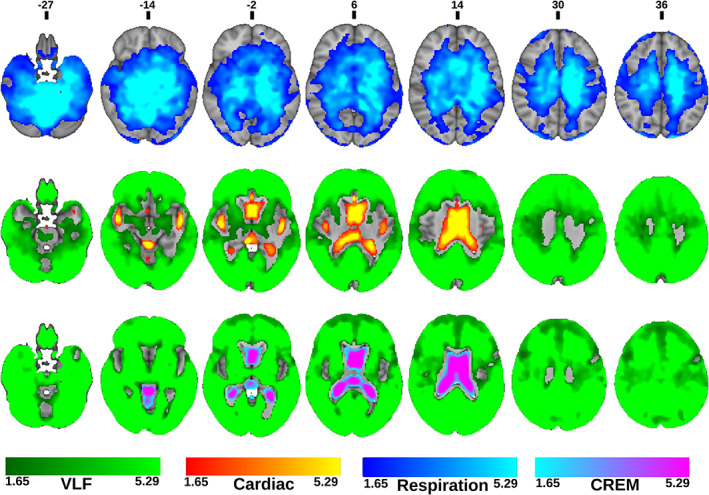
FIGURE 5.

Statistical amplitude of very low frequency fluctuation (AFVLF) comparison maps. Statistical comparison of AFVLF to amplitude of respiratory fluctuation (AFresp)(top), amplitude of cardiac fluctuation (AFcard) (middle) and amplitude of cardiorespiratory envelope modulation (AFCREM) (bottom). Colors in the maps represent where AFcard (Red), AFresp (blue) or AFCREM (Purple), respectively, are higher compared to AFVLF. (green) indicates where AFVLF dominates over the compared frequency. (FDR corrected, p < .05 with respective z‐score encoding). Note the missing difference in the amplitudes between respiration and VLF in the cortex
