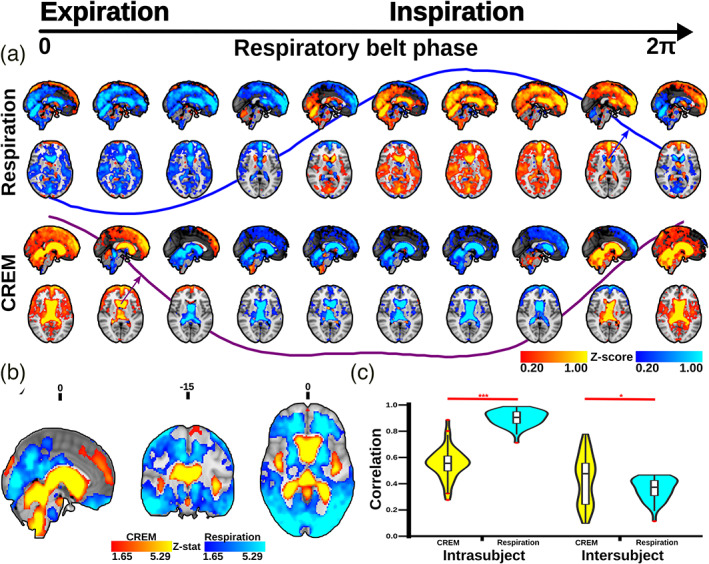
FIGURE 9.

Quasi‐periodic patterns (QPP) waves: (a) 3D time lapsed, group averaged, and phase‐matched QPP waves of respiration and cardiorespiratory envelope modulation (CREM) pulsations triggered to the respiratory belt inspiratory maximum. The color bars indicate group average normalized z‐score values (b) Brain regions significantly different with respect to spatial distribution of amplitude between respiration and CREM QPP waves (p < .05, FDR corrected). The color bars indicate the z‐stat values. Red denotes higher amplitude in CREM and blue indicates higher amplitude in respiration (c) Violin plots show the average spatial correlation between intra‐ and inter‐subject level correlations of respiration and CREM. Student t‐test: * p < .05, *** p < .001
