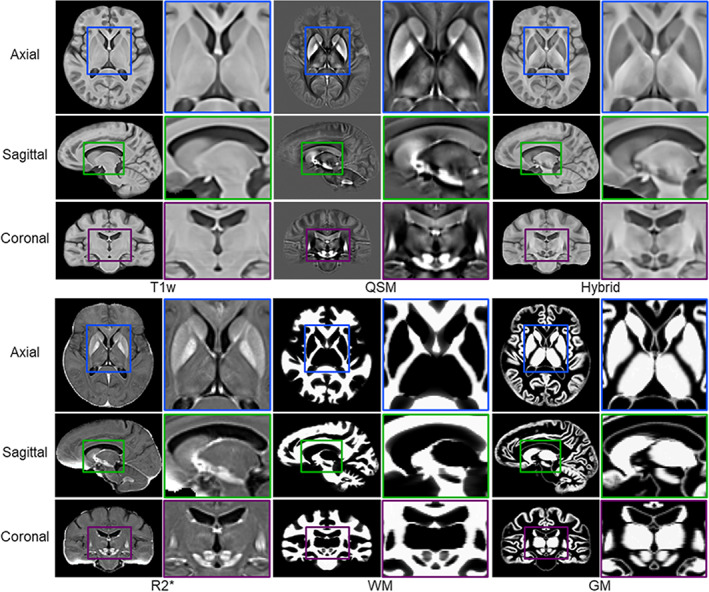
FIGURE 7.

The HybraPD atlas exhibited via T1w, QSM, hybrid, R2* templates, and brain tissue probabilistic maps (WM and GM), with enlarged views to illustrate clear contrast in detail for the subcortical nuclei. The atlases are shown by representative sections in the axial, sagittal, and coronal views
