FIGURE 11.

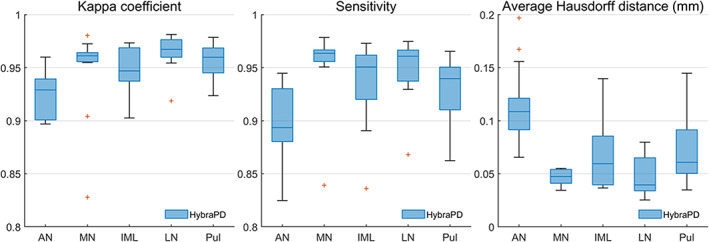
Evaluation parameters showing the accuracy of segmentation for five sub‐regions of the thalamus from the HybraPD atlas. From left to right: Kappa coefficient; Sensitivity; average Hausdorff distance

Evaluation parameters showing the accuracy of segmentation for five sub‐regions of the thalamus from the HybraPD atlas. From left to right: Kappa coefficient; Sensitivity; average Hausdorff distance