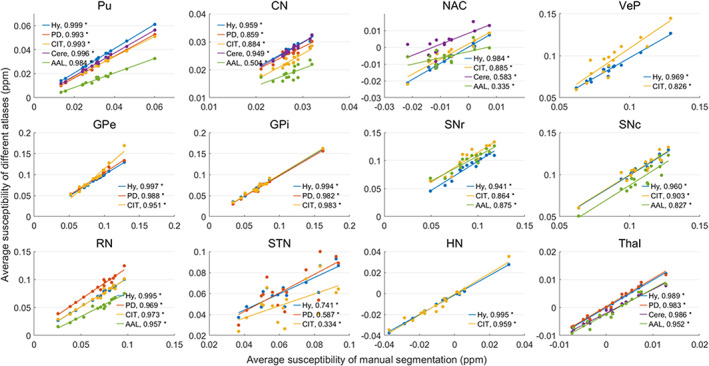
FIGURE 13.

Regression of the average susceptibility between manual segmentation and co‐registered atlases. Hy, HybraPD; PD, PD25; CIT, CIT168; Cere, CerebrA; AAL, AAL3. The R 2 coefficients are given in the image. “*”: p‐value <.05; “ns”: nonsignificant
