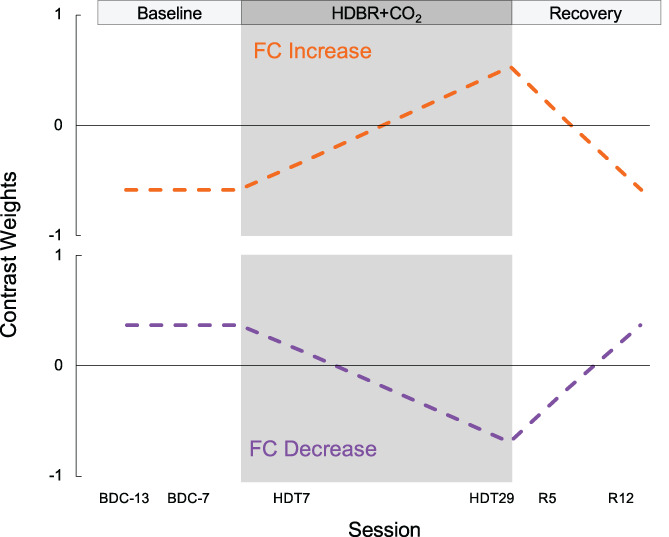
FIGURE 2.

Contrast models used to longitudinal FC changes. The gray shaded region indicates the HDBR+CO2 phase. The model shown in orange was used to identify brain networks showing stable FC across the baseline phase followed by a gradual FC increase during HDBR+CO2, then a gradual return to baseline following bed rest. The model shown in purple was used to identify brain networks showing stable FC across the baseline phase followed by a gradual FC decrease during HDBR+CO2, then a gradual return to baseline following bed rest. BDC, baseline data collection; HDBR+CO2, head down‐tilt bed rest with elevated carbon dioxide; R, recovery; FC, functional connectivity
