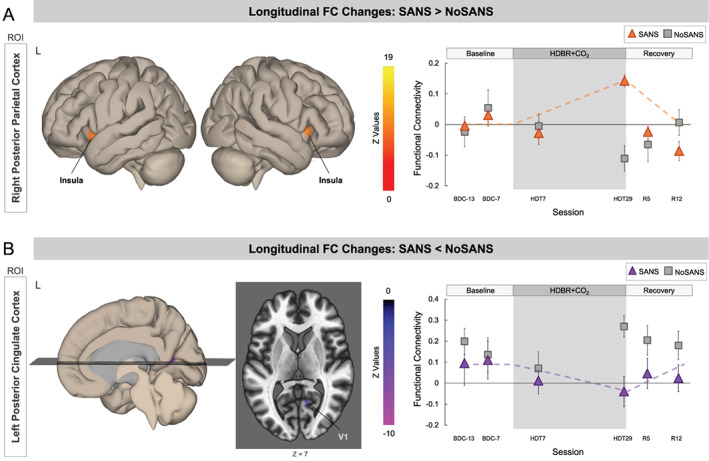
FIGURE 3.

Differential longitudinal FC changes between the SANS and NoSANS subgroups. (a) The NoSANS subgroup (gray squares) showed a FC decrease between the ROI in right posterior parietal cortex (PPC) and clusters in bilateral insular cortices during HDBR+CO2 followed by a post‐bed rest reversal. The SANS subgroup (triangles) exhibited FC increases between these regions during HDBR+CO2 followed by a post‐bed rest decrease. (b) The NoSANS subgroup (gray squares) showed a FC increase between the ROI in left posterior cingulate cortex (PCC) and right primary visual cortex (V1) during HDBR+CO2 followed by a post‐bed rest reversal. The SANS subgroup (triangles) exhibited a FC decrease between these regions during HDBR+CO2 followed by a post‐bed rest increase. The dashed line on each graph represents the hypothesized longitudinal model. Error bars represent standard error. L, left; R, right; ROI, region of interest; FC, functional connectivity; SANS, spaceflight associated neuro‐ocular syndrome; HDBR+CO2, head down‐tilt bed rest with elevated CO2
