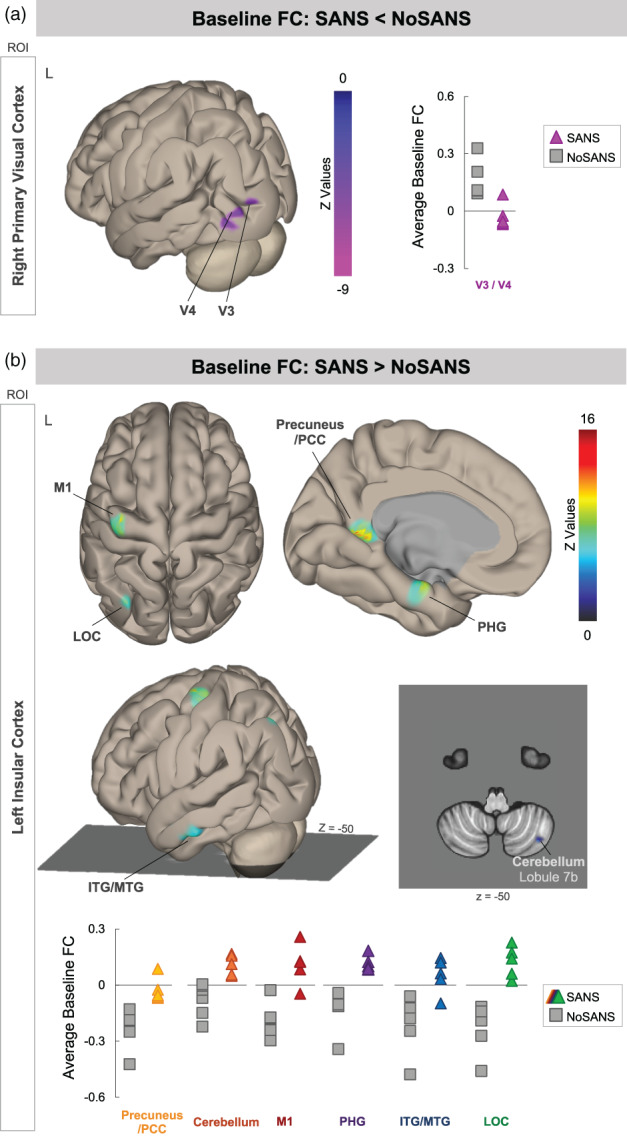
FIGURE 4.

Pre‐bed rest FC differences between the SANS and NoSANS subgroups. (a) During the baseline phase, the NoSANS subgroup (gray squares) exhibited FC between the ROI in right primary visual cortex (V1) and visual areas V3 and V4 within the left hemisphere. The SANS subgroup exhibited an anti‐correlation or lower FC between visual brain areas prior to bed rest (colored triangles) prior to the HDBR+CO2 intervention. (b) During the baseline phase, the NoSANS subgroup (gray squares) exhibited anti‐correlations between the ROI in left insular cortex and left primary motor cortex (M1), lateral occipital cortex (LOC), inferior and middle temporal gyri (ITG/MTG), parahippocampal gyrus (PHG), precuneus/posterior cingulate cortex (PCC), and right cerebellar lobule 7b. The SANS subgroup (colored triangles) exhibited greater FC than the NoSANS subgroup during the baseline phase. FC, functional connectivity; L, left; ROI, region of interest; SANS, spaceflight associated neuro‐ocular syndrome
