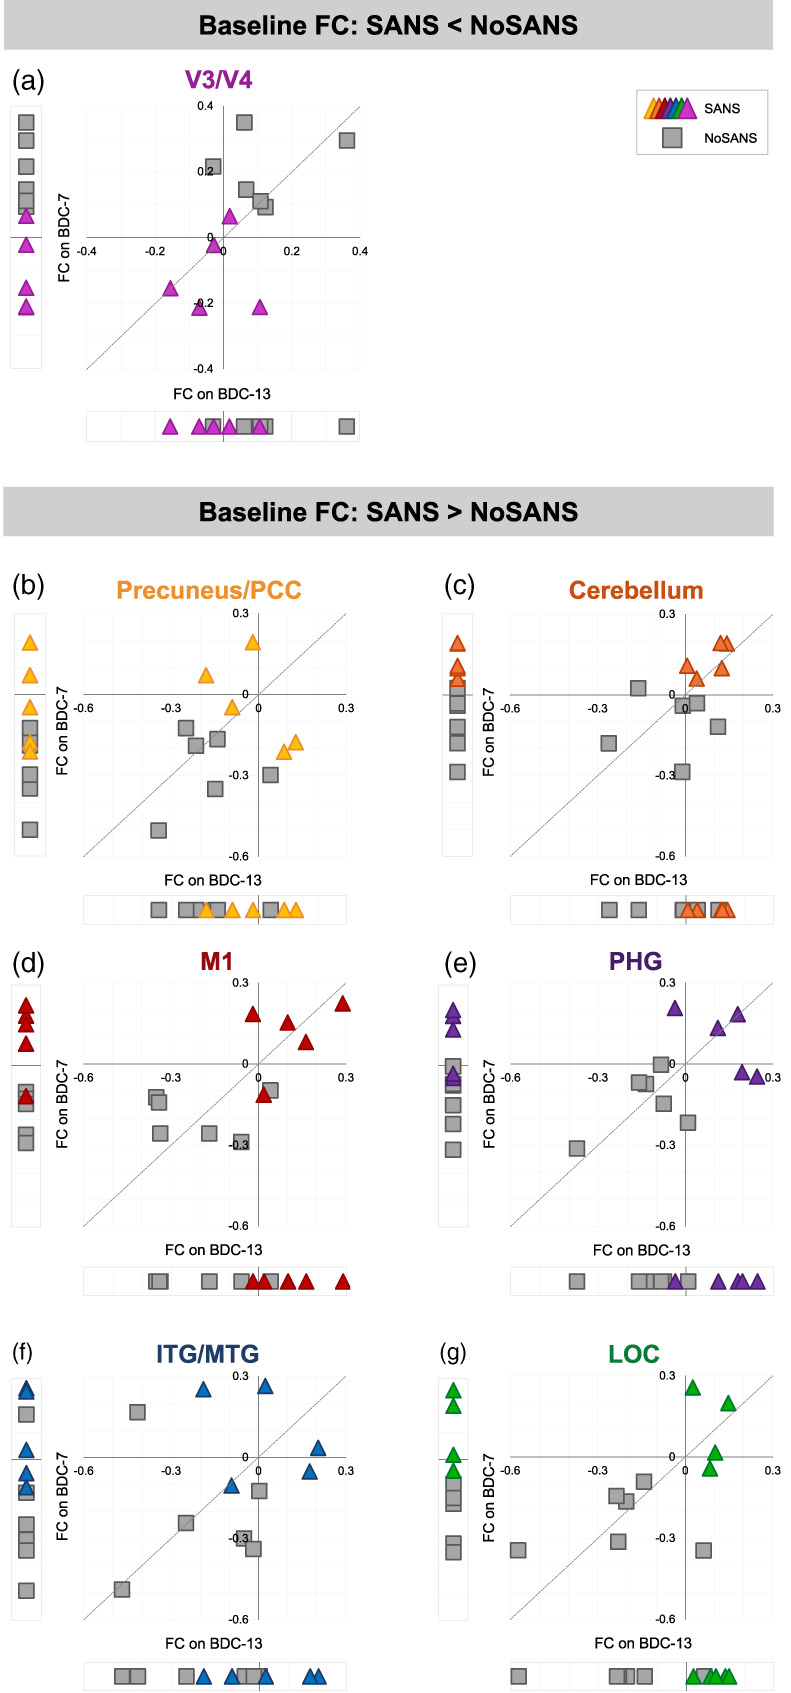
FIGURE 5.

Baseline FC values. Within each panel, we present session‐wise FC values between the indicated target cluster and the ROI in right primary visual cortex (a) or the ROI in left insular cortex (b–g). Each marker represents data from one participant. Triangle markers indicate participants who developed signs of SANS during the HDBR+CO2 intervention (SANS). Square markers indicated participants who did not develop signs of SANS (NoSANS). At the bottom of each scatterplot, we present subject‐wise FC values from the BDC‐13 session. To the left, we present subject‐wise FC values estimated during the BDC‐7 session. The scatterplot shows BDC‐13 FC values plotted against BDC‐7 FC values for each participant. The identity line is represented by the dashed line. FC, functional connectivity; BDC, baseline data collection; PCC, posterior cingulate cortex; M1, primary motor cortex; PHG, parahippocampal gyrus; ITG/MTG, inferior and middle temporal gyri; LOC, lateral occipital cortex; SANS, spaceflight associated neuro‐ocular syndrome
