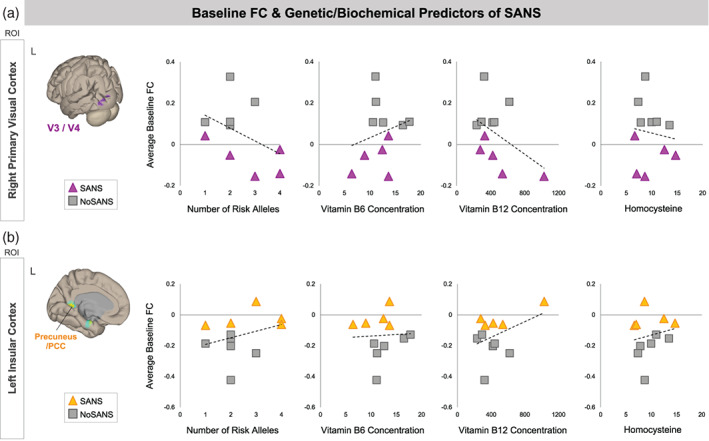
FIGURE 7.

Associations between baseline FC values and SANS biomarkers. Scatterplots show relationships between the number of risk alleles, Vitamin B6 and B12 concentration, and homocysteine with participants' pre‐bed rest FC (i.e., averaged across BDC‐13 and BDC‐7). Triangle markers indicate participants who developed signs of SANS during the HDBR+CO2 intervention (SANS). Square markers indicated participants who did not develop signs of SANS (NoSANS). Dashed lines indicate the linear trendline across all 11 participants. (a) In the upper panel, y axes indicate baseline FC values between the ROI in right primary visual cortex and target clusters spanning left V3 and V4. (b) In the lower panel, y axes indicate baseline FC values between the ROI in left insular cortex and A target cluster in left precuneus/posterior cingulate cortex. FC, functional connectivity; L, left; ROI, region of interest; SANS, spaceflight associated neuro‐ocular syndrome
