
FIGURE 3.
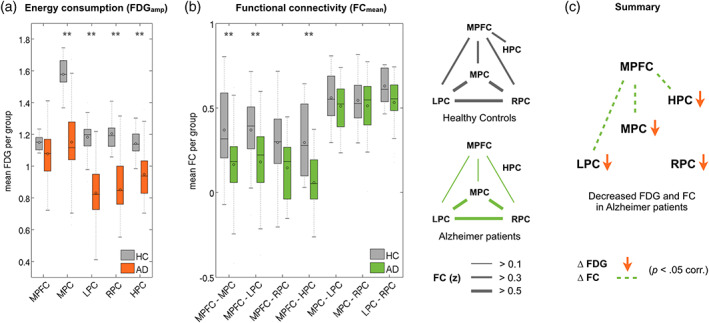
Energy metabolism and functional connectivity in the DMN. (a) Bar plots indicate decreased energy metabolism (FDGamp) in medial (MPC), left (LPC), and right (RPC) parietal cortex, and in hippocampus (HPC) of patients with AD (orange) compared to healthy controls (gray). (b) Left: Bar plots indicate decreased pairwise functional connectivity (FCmean) of fronto‐parietal and fronto‐hippocampal connections in the patient group (green) compared to healthy controls (gray). Right: Graphical illustration of significant FC among all DMN regions in healthy controls and patients. (c) Summary illustrating significantly decreased energy metabolism (orange arrows) and FC (dotted lines) in the DMN of patients with AD. **p < 0.05 Bonferroni corrected. See Supporting Information Tables S1 and S2 for full statistics