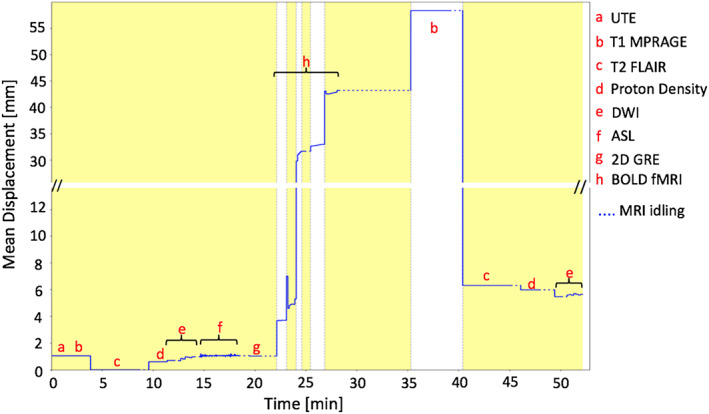
FIGURE 2.

Mean displacement plot for the motion instructed volunteer demonstrating the head movement with respect to the T2 weighted reference image, as detected by the multicontrast registration method. The yellow/white alternation bands indicate the durations of successive motion correction frames
