
FIGURE 3.
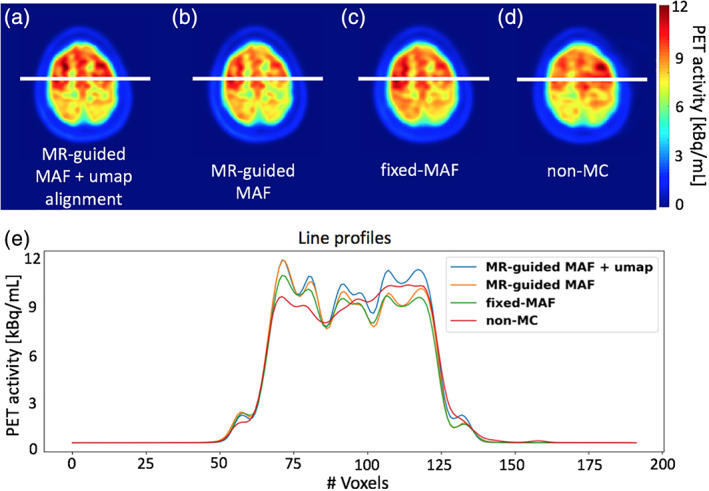
Motion correction results for the controlled motion experiment. Images in panels (a)–(d) show the reconstructed PET images using different reconstruction methods. The plots in panel (e) show the signal intensity variation along the line profiles in panel (a)–(d)