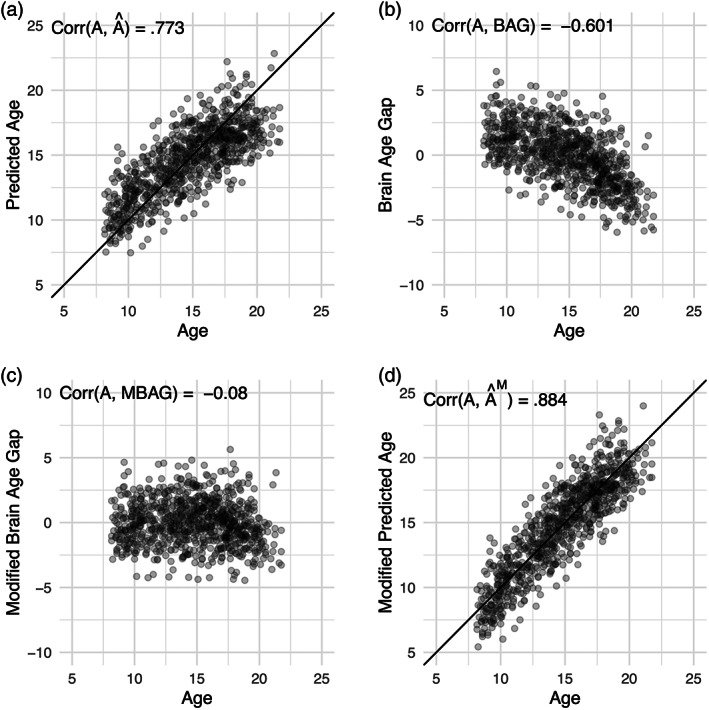
FIGURE 2.

The inflated correlation finding was replicated in the Philadelphia Neurodevelopmental Cohort. Plotted are values for age (A), predicted age (), the brain age gap (BAG), the modified BAG (MBAG) and the modified predicted age () in the subset of participants who met screening criteria for an instance of mental illness in their lifetime. Panel (a) displayed the correlation between age and predicted age; Panel (b) the correlation between age and the brain age gap; Panel (c) the correlation between age and the modified brain age gap; and Panel (d) the correlation between age and the modified predicted age. The identity line is displayed in Panels (a) and (d)
