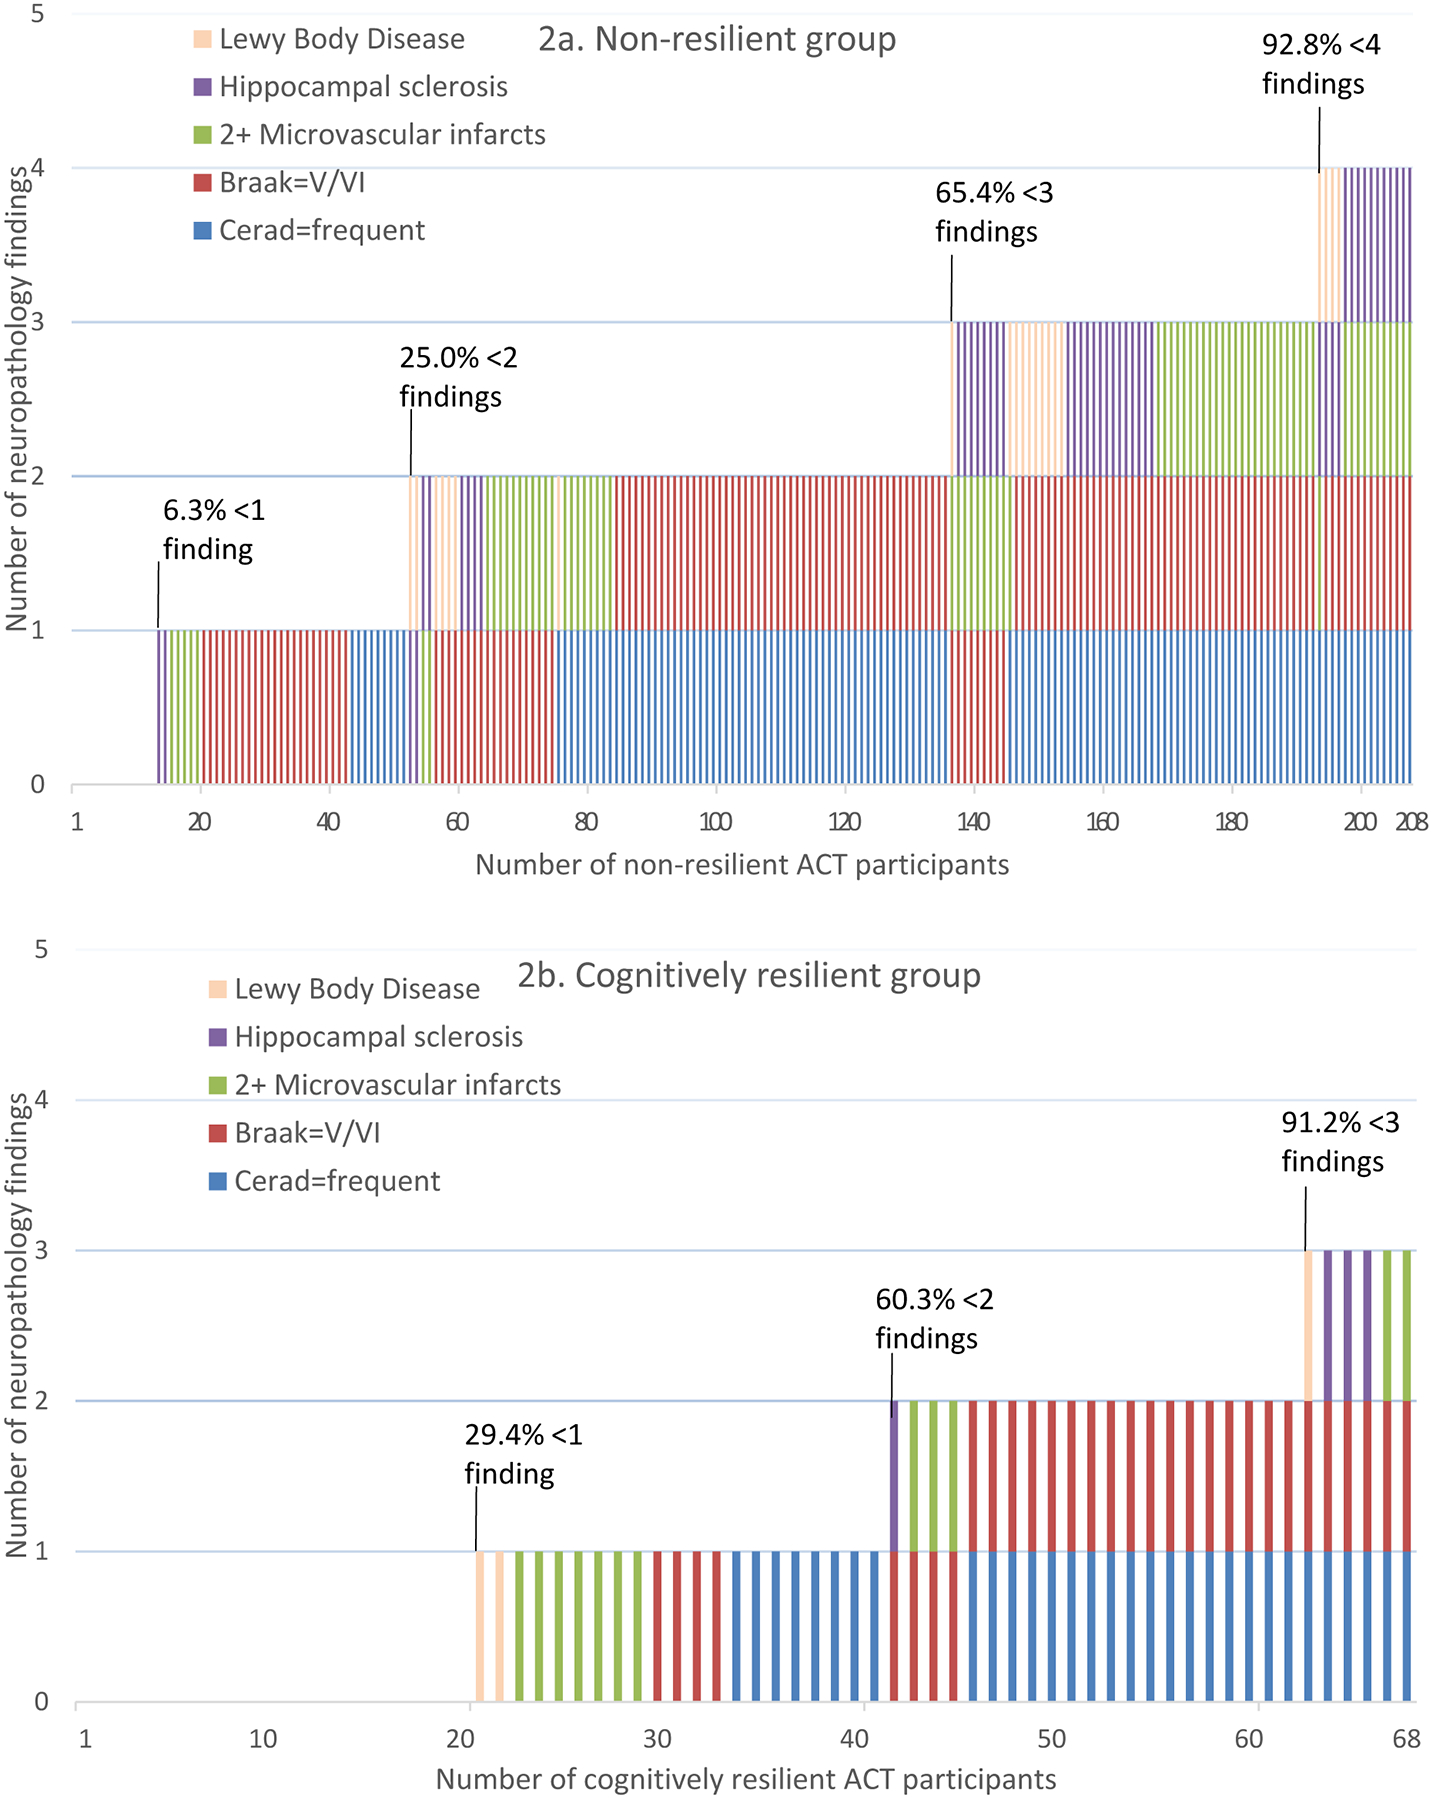
Figure 2a and 2b.

Distribution of multiple neuropathology characteristics across ACT study participants, stratified by cognitively resilient and non-resilient groups. This figure shows the distribution of five neuropathology findings (Lewy Body Disease, hippocampal sclerosis, 2+ microvascular infarcts, Braak stage V/VI, and frequent CERAD score) by number of non-resilient (2a) and cognitively resilient (2b) study participants. The figure shows the combinations of various neuropathology findings and the proportions of non-resilient (2a) and cognitively resilient (2b) groups that have <1, <2, <3 or <4 findings. People with no findings have Braak stage III/IV and intermediate CERAD score.
