Figure 5.
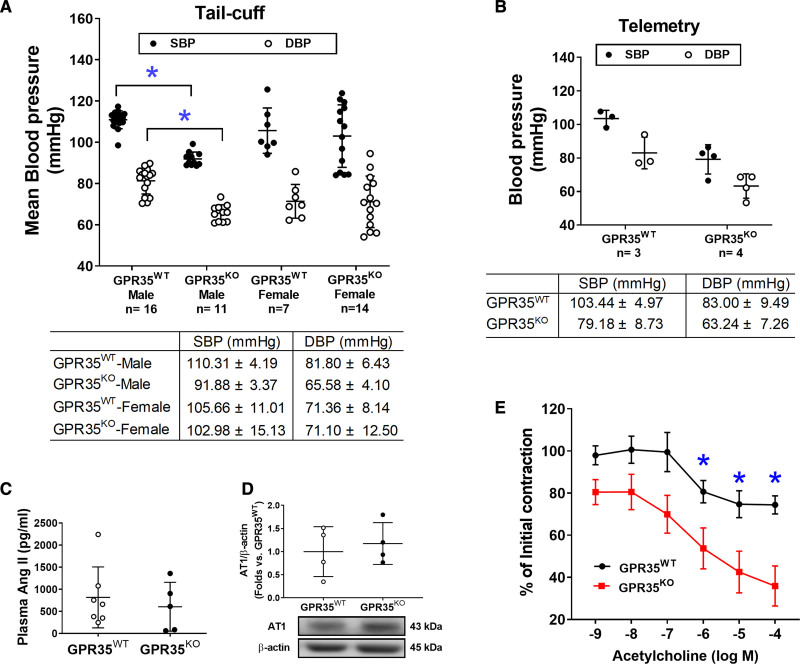
Blood pressure (BP) and endothelium-dependent vasodilation in GPR35WT (G-protein–coupled receptor 35 wild-type control) and GPR35KO mice under physiological conditions.A, Systolic blood pressure (SBP) and diastolic blood pressure (DBP) of GPR35WT and GPR35KO adult male and female mice measured by tail-cuff method. The n numbers are shown underneath each group on x axis. The mean values of each group are shown underneath the dot plot. One-way ANOVA test was done, then the pairs of focused groups were tested with a 2-sample t test and P values were adjusted with Hommel’s method. *P<0.05 vs GPR35WT male. B, SBP and DBP of GPR35WT and GPR35KO male mice by implanted telemetry transmitter. n=3 in GPR35WT, n=4 in GPR35KO. Statistical analysis was not performed due to the small sample size. C, Plasma Ang II (angiotensin II) levels in GPR35WT and GPR35KO male mice. n=7 in GPR35WT, n=5 in GPR35KO. Mann-Whitney U test did not reach statistical significance. D, The AT1 (Ang II receptor 1) protein expression in mouse aortic endothelial cells (MAECs) from GPR35WT and GPR35KO male mice. n=4 per group. Mann-Whitney U test did not reach statistical significance. Representative bands are shown underneath the dot plot. E, Endothelium-dependent vasocontraction of aorta isolated from GPR35KO vs GPR35WT male mice expressed as % initial contraction induced by phenylephrine. n=6. *FDR adjusted Mann-Whitney test Q value<0.05. In all the figures, horizontal lines show mean±SD.

