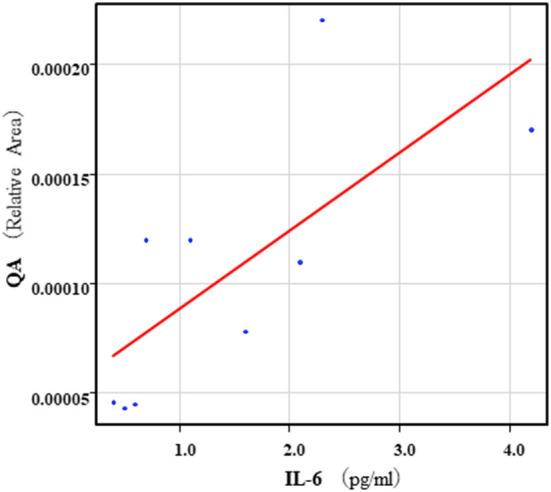
Figure 6.

Association between serum IL-6 levels and serum QA levels in the healthy control group. A positive correlation was found between the serum IL-6 levels and the serum QA levels (r = 0.78, p = 0.010) in the healthy control group. Relative Area: The peak areas of the metabolites were normalized against those of the internal standards, and the resultant relative areas were further normalized by the sample amount explained in the Measurement of metabolites of the Kyn pathway. Thus, serum QA levels demonstrated as the ratio comparing with internal standard.
