
Fig 2.
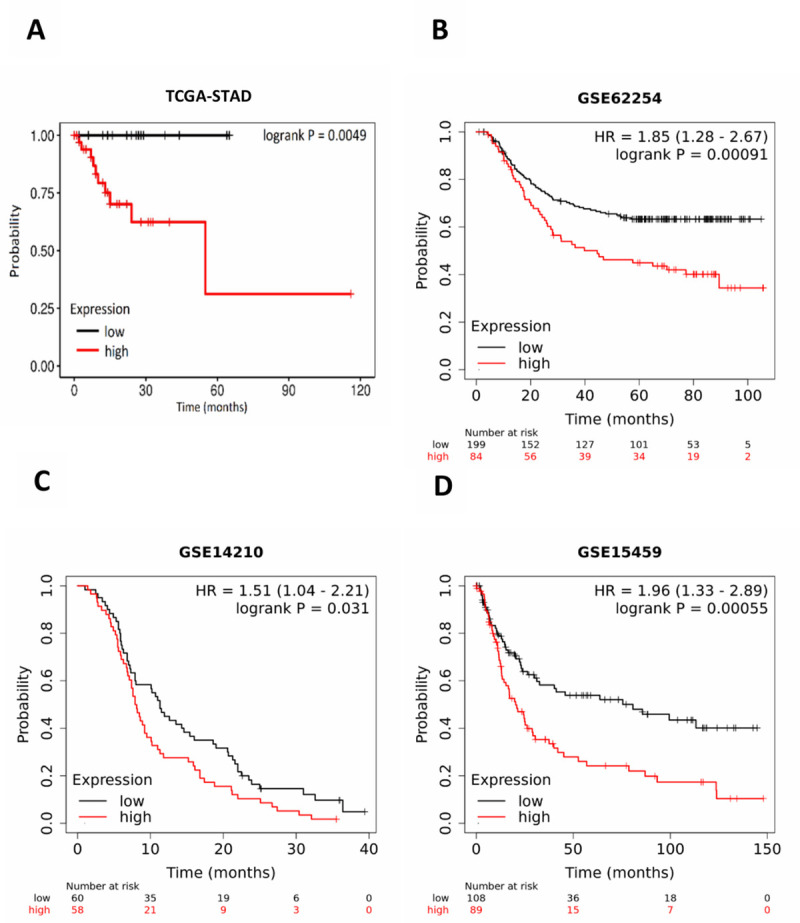
Kaplan-Meier plots of the survival analysis of GC patient data: Kaplan-Meier plots of the survival analysis of GC patient data from the TCGA RNA sequencing datasets (A) and three publicly available Gene Expression Omnibus (GEO) datasets, namely, (B) GSE62254 ACRG (Asian Cancer Research Group, N = 300) gastric cohort, (C) GSE14210 (metastatic gastric cancer patients, N = 145) and (D) GSE15459 (primary gastric tumors from Singapore patient cohort, N = 200) The patients are stratified in two groups (high expression in red and low expression in black) according to the expression profiles of ASPN. P-values for the significance of the difference between high and low expression were calculated using the log-rank test.