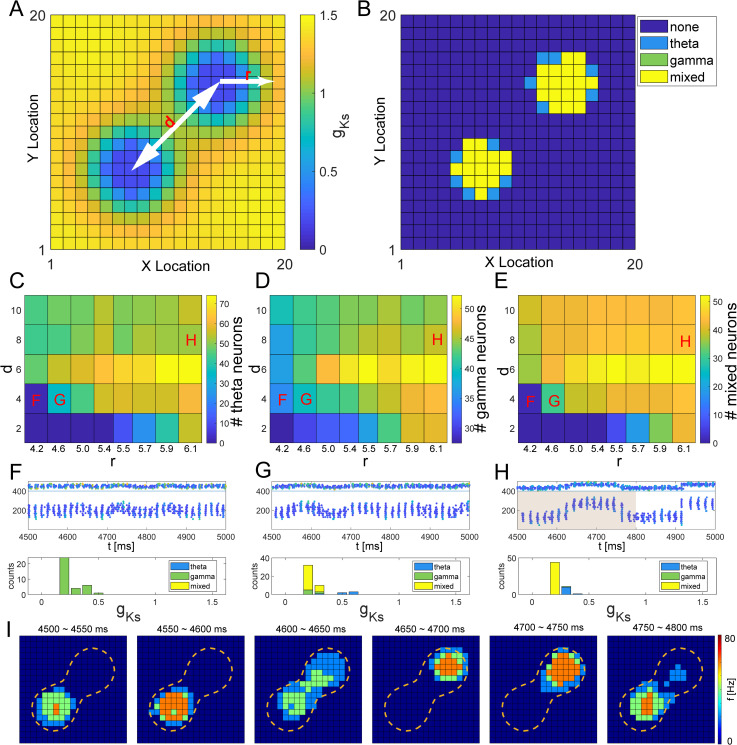
Fig 4. Theta/gamma band rhythms generated with a double peaked spatial distribution of gKs.
A, Example of double peaked spatial mapping of gKs values for corresponding neurons on the 20×20 E cell lattice for hotspot radius r = 4.6 and distance between hotspot centers d = 8. B, Dominant rhythmic activity of individual E cells (dark blue = none, light blue = theta band, green = gamma band and yellow = mixed, both gamma and theta) plotted at cell position on the E cell lattice due to double peaked gKs spatial distribution shown in A. C, D and E, Numbers of neurons exhibiting dominant theta (C), dominant gamma (D), or theta-gamma coupled activity (E) as a function of radius of gKs hotspots r and the distance between hotspot centers d for a double peaked gKs spatial distribution. F, G and H, Spike raster plots (top panels) and histograms for the dominant rhythmic activity exhibited by neurons based on their individual gKs values (bottom panels) for networks with double peaked gKs distributions with r and d values indicated by labels in C, D, E. In the raster plots, E cells are numbered 1 to 400, and I cells are numbered 401 to 500. Color indicates gKs values of cells with the scale in A. I, Snapshots of E cell firing rates from 4500–4800 ms during the simulation in H (shaded area in H; r and d values indicated by label H in C). Cells inside the orange contour lines have values less than 0.6 mS/cm2.

