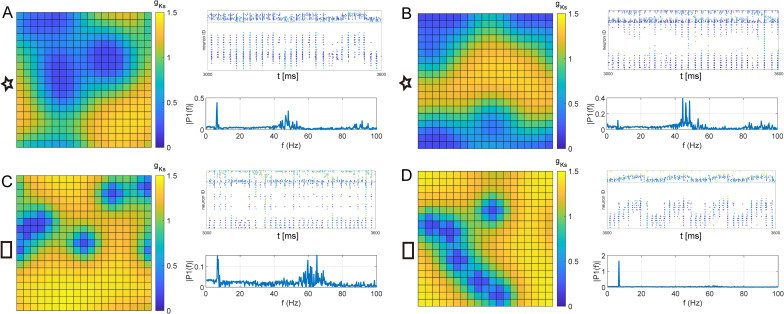
Fig 5. Examples of variability in theta/gamma rhythms for randomly generated spatial gKs distributions.
The gKs spatial mappings (color plots), network spike raster plots (right panels, top) and network frequency power spectrum (right panels, bottom) for two pairs (A, B and C, D) of gKs map realizations with the same sets of parameters. A, B The results of 2 random gKs mappings with 6 hotspots of radius r = 5.4 (marked by ’star’ in S5 Fig). C, D The results of 2 random gKs mappings with 6 hotspots of radius r = 2.8 (marked by ’square’ in S5 Fig).

