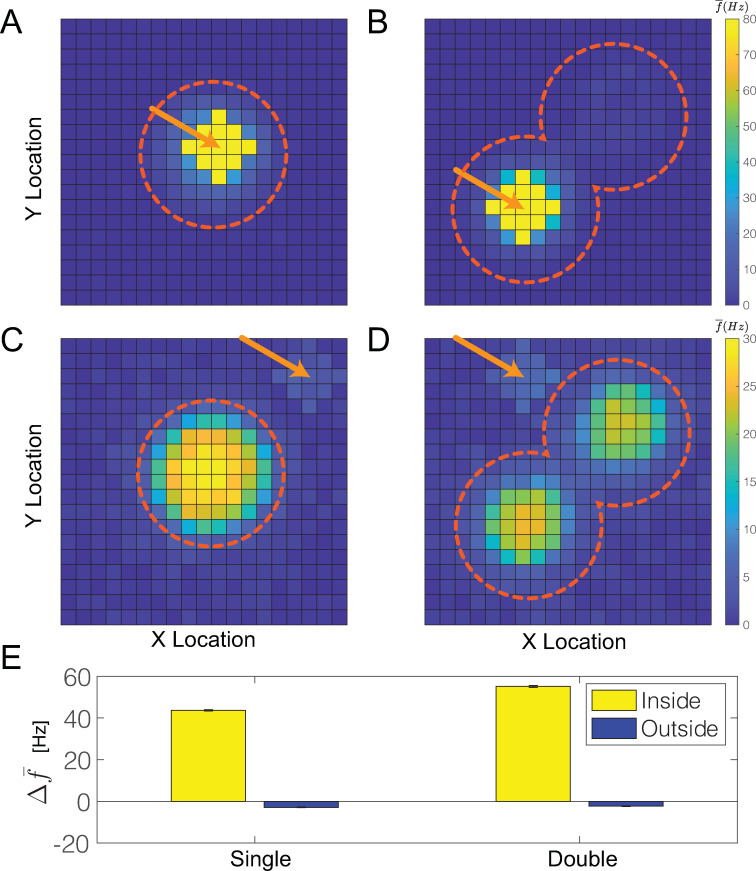
Fig 7. Firing response to an external stimulus with single and double peak gKs spatial distributions.
A, B, C, D, Average E cell firing frequencies plotted as cell position on the E cell lattice showing varied firing responses to an external excitatory stimulus targeting a subset of E cells. Dashed circles indicate location and radius of gKs hotspots and arrows indicate location of targeted cells. Targeted cells were either inside (A, B) or outside (C, D) of the gKs hotspot. E, The change in average firing responses of the targeted E cells to the external stimulus relative to their responses in the absence of gKs modulation (homogeneous gKs at default value). Yellow (blue) bars correspond to when targeted E cells are inside (outside) the gKs hotspot. The four bars from left to right correspond to cases shown in A, C, B and D, respectively.

