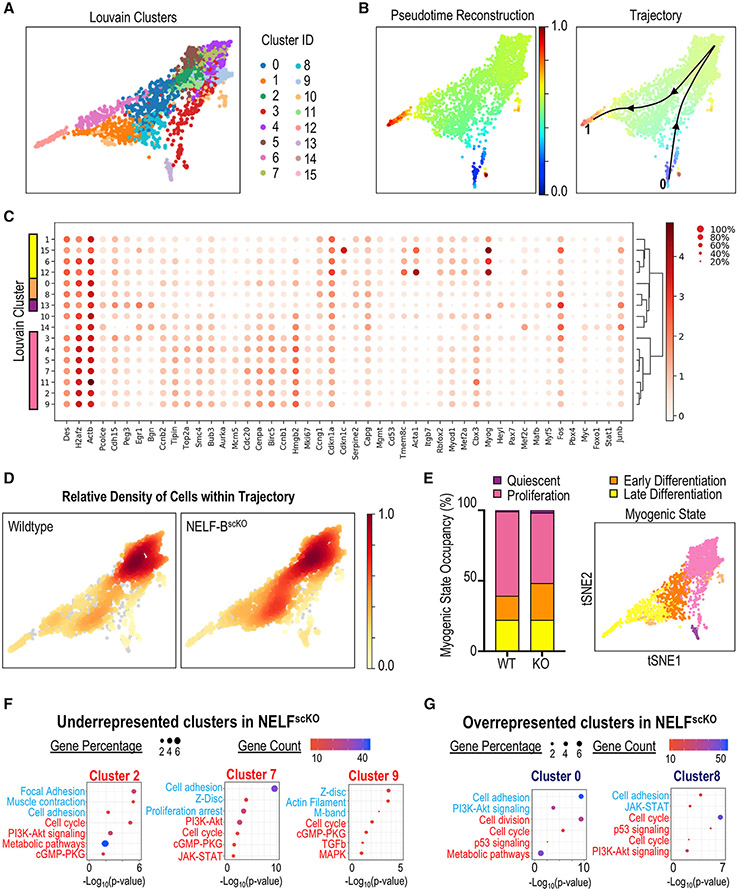
Figure 5. Single-cell transcriptome analysis of muscle progenitors in regeneration.
Myogenic progenitor cells (TdT+, ITGA7+) were isolated from CTX injured hind-limb muscles at 72 h post-injury, sorted based on fluorescence, and subjected to scRNA-Seq using the 10x genomic platform.
(A) Myogenic cells were clustered using the PAGA algorithm, which identified 16 different Louvain clusters on combined cell analysis for NELF-BscKO and WT samples.
(B) Pseudotime trajectory re-construction using the PAGA algorithm shows the cell trajectory across 16 clusters from the Pax7+ MuSCs (blue), through to the Myog+ myocytes (red).
(C) Dotplot analysis of the 16 clusters on selected genes shows differences in Louvain cluster gene signatures.
(D) Density mapping of WT and NELF-BscKO myoblasts on the PAGA trajectory reveals differential population occupancy in clusters 0 and 8 (up in NELF-BscKO) as well as clusters 2, 7, and 9 (down in NELF-BscKO).
(E) Cells were classified into different myogenic cell states based on global gene signatures representing quiescence (cluster 13), proliferation (cluster 2,3,4,5,7,9,11), early differentiation (cluster 0,8), and late differentiation (cluster 1,6,12,15).
(F and G) Gene Ontology analysis was performed on differentially expressed genes identified in the 5 clusters that were either underrepresented (F) or overrepresented (G) in NELF-BscKO mice. Representative upregulated (blue) and downregulated (red) GO terms are shown as a function of Log10(p-value).

