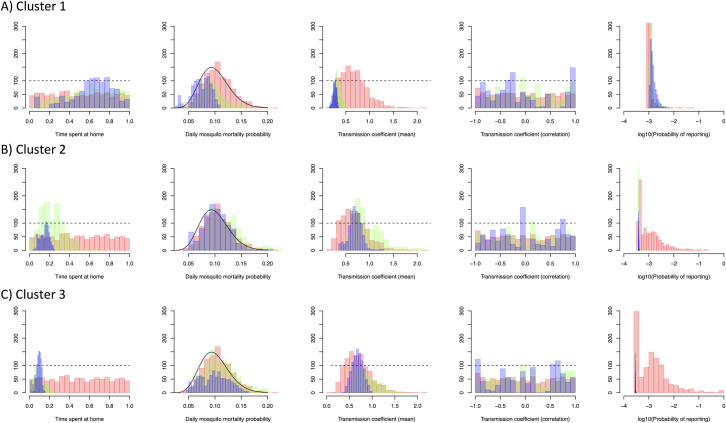
Fig 4.
Histograms of the distribution of each model parameter using the best fitting human movement model (exponential for cluster 1, gravity for clusters 2 and 3) over successive sequential Monte Carlo rounds (Red = round 1, Green = round 2, Blue = Round 3). Probability of reporting is on a logarithmic scale (base 10).

