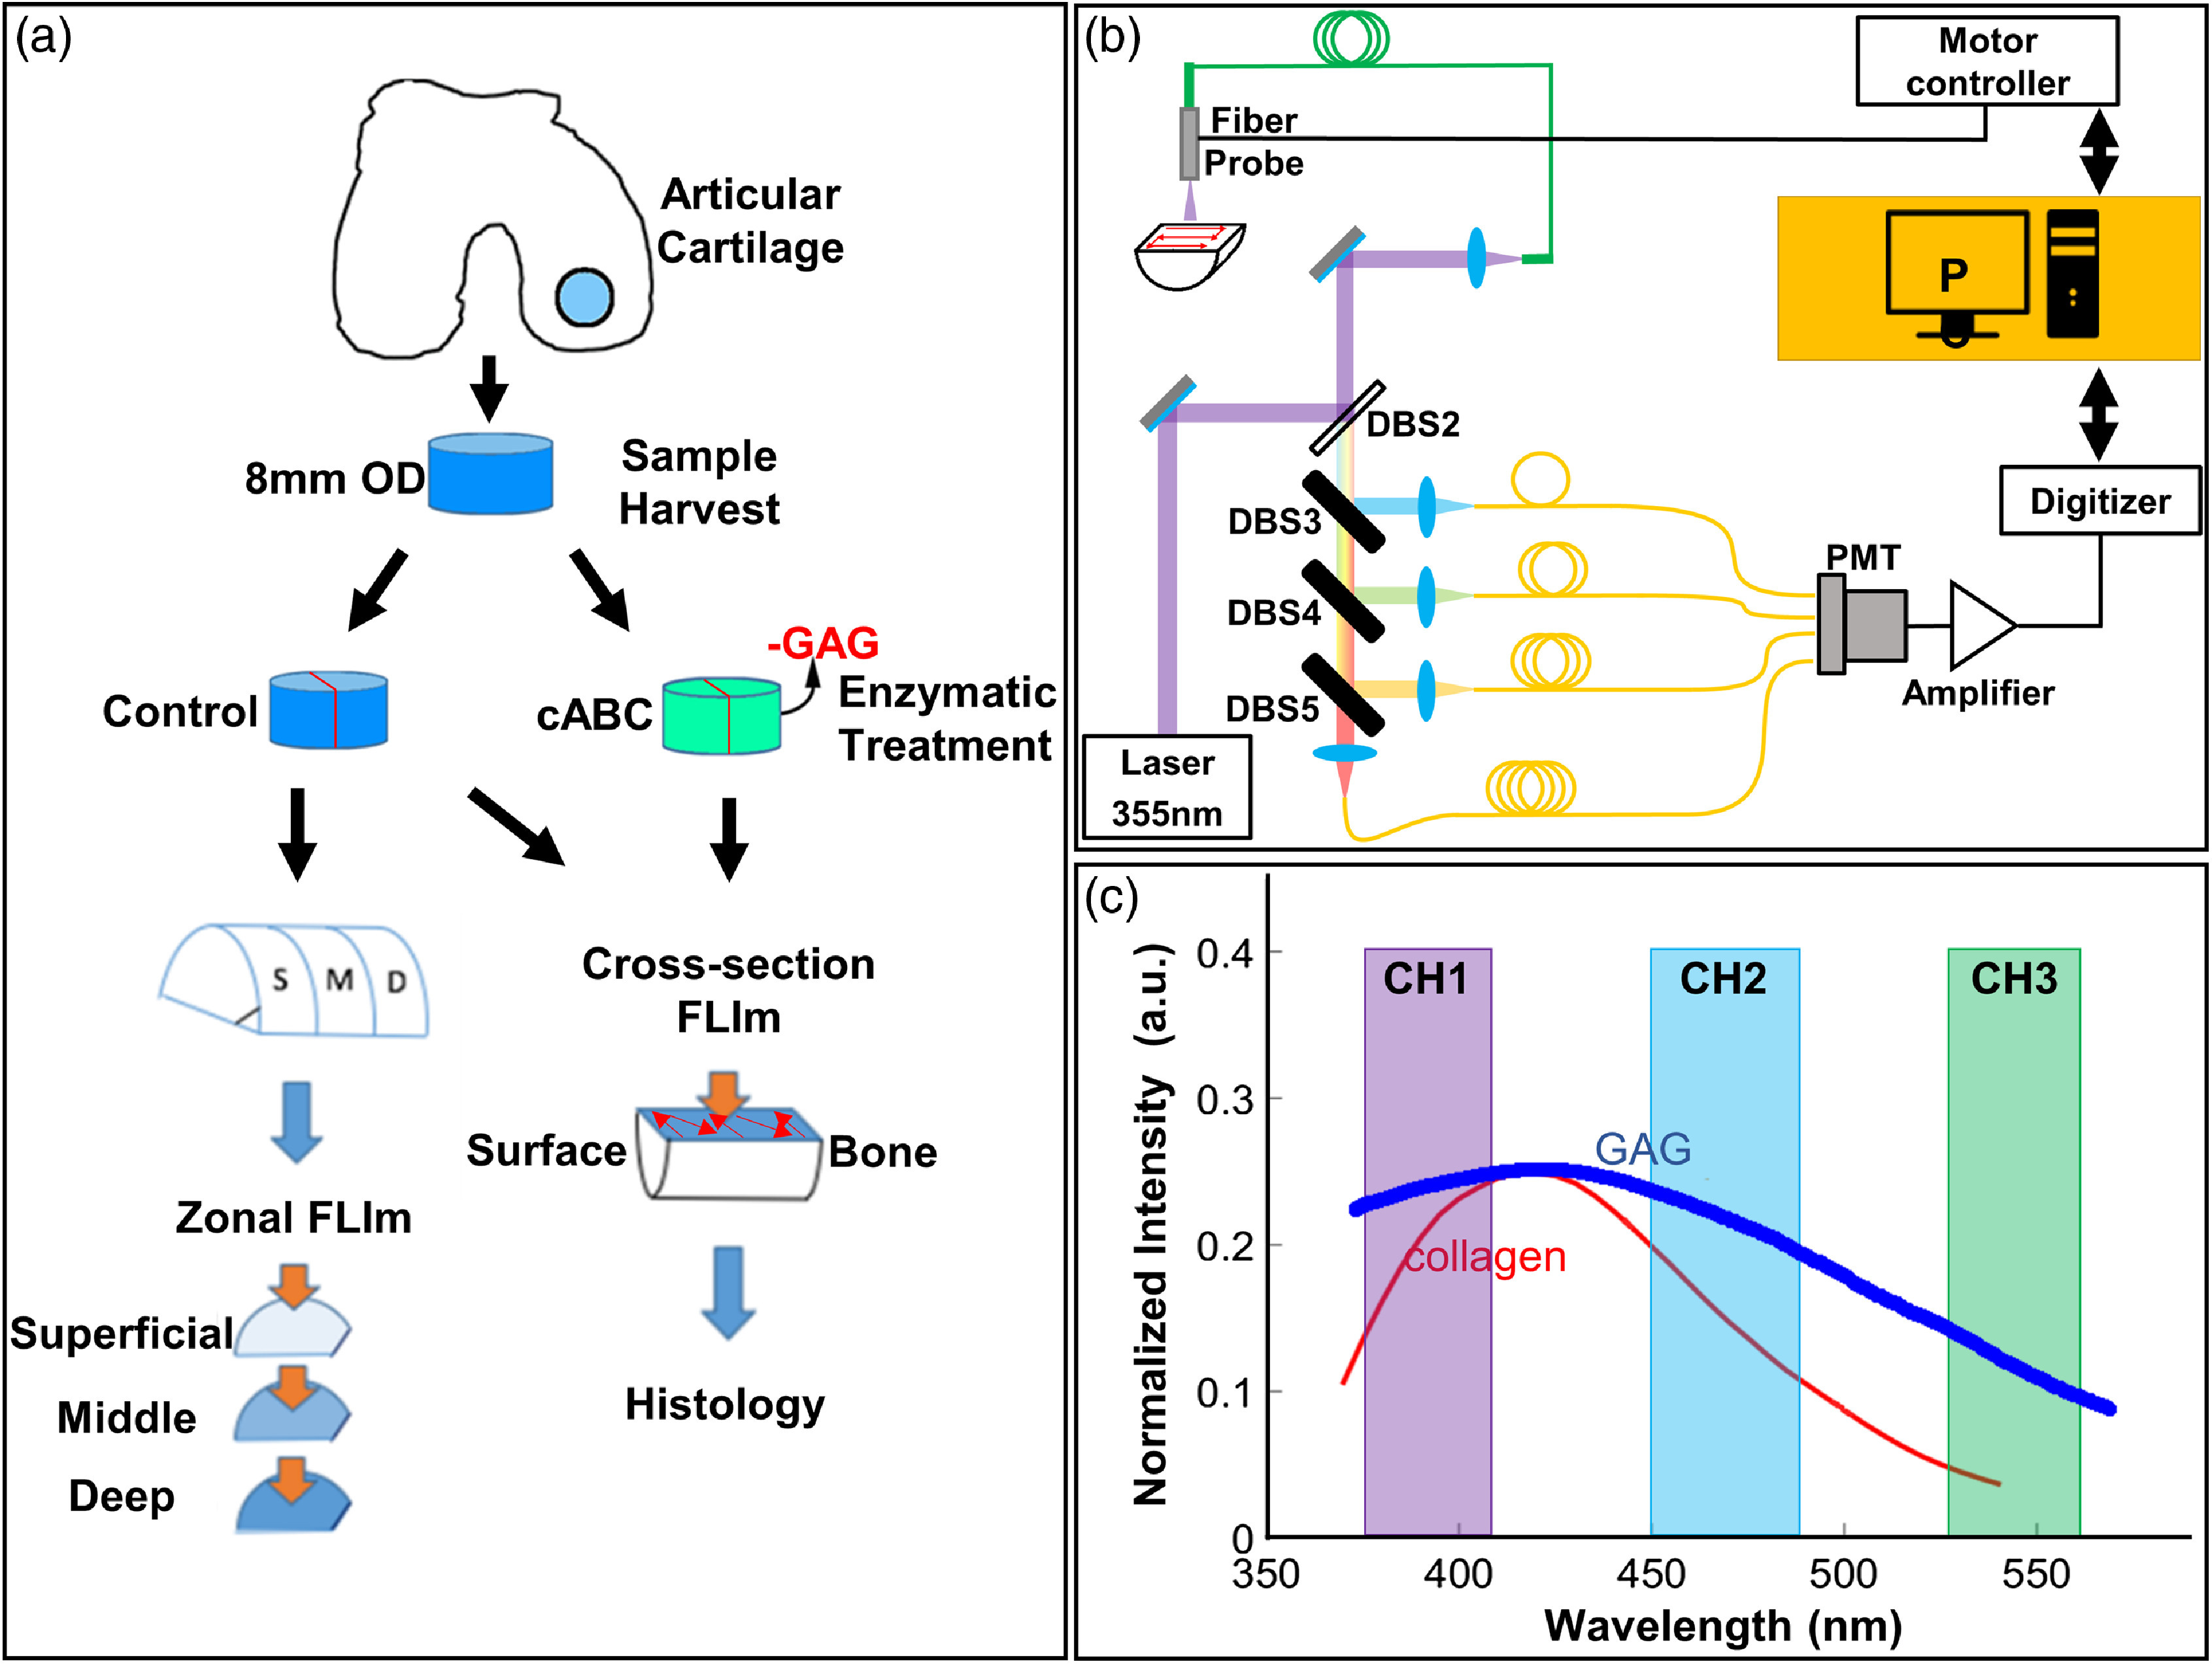
Fig. 1.

(a) Schematic diagram of the study protocol. Harvest and treatment of bovine articular cartilage samples in untreated (control) and cABC groups. Zonal en-face imaging was conducted on samples from different depths of cartilage from control group. Cross-sectional imaging was conducted on both control and cABC treatment groups. (b) Schematic diagram of the FLIm system. FLIm images were acquired by raster scanning of the optical fiber. (c) Spectral channels of the FLIm instrument: channel 1 = 375 to 410 nm, channel 2 = 450 to 485 nm, and channel 3 = 530 to 565 nm. The reference emission spectrum of collagen (red) and GAG (blue)24 was also overlaid.
