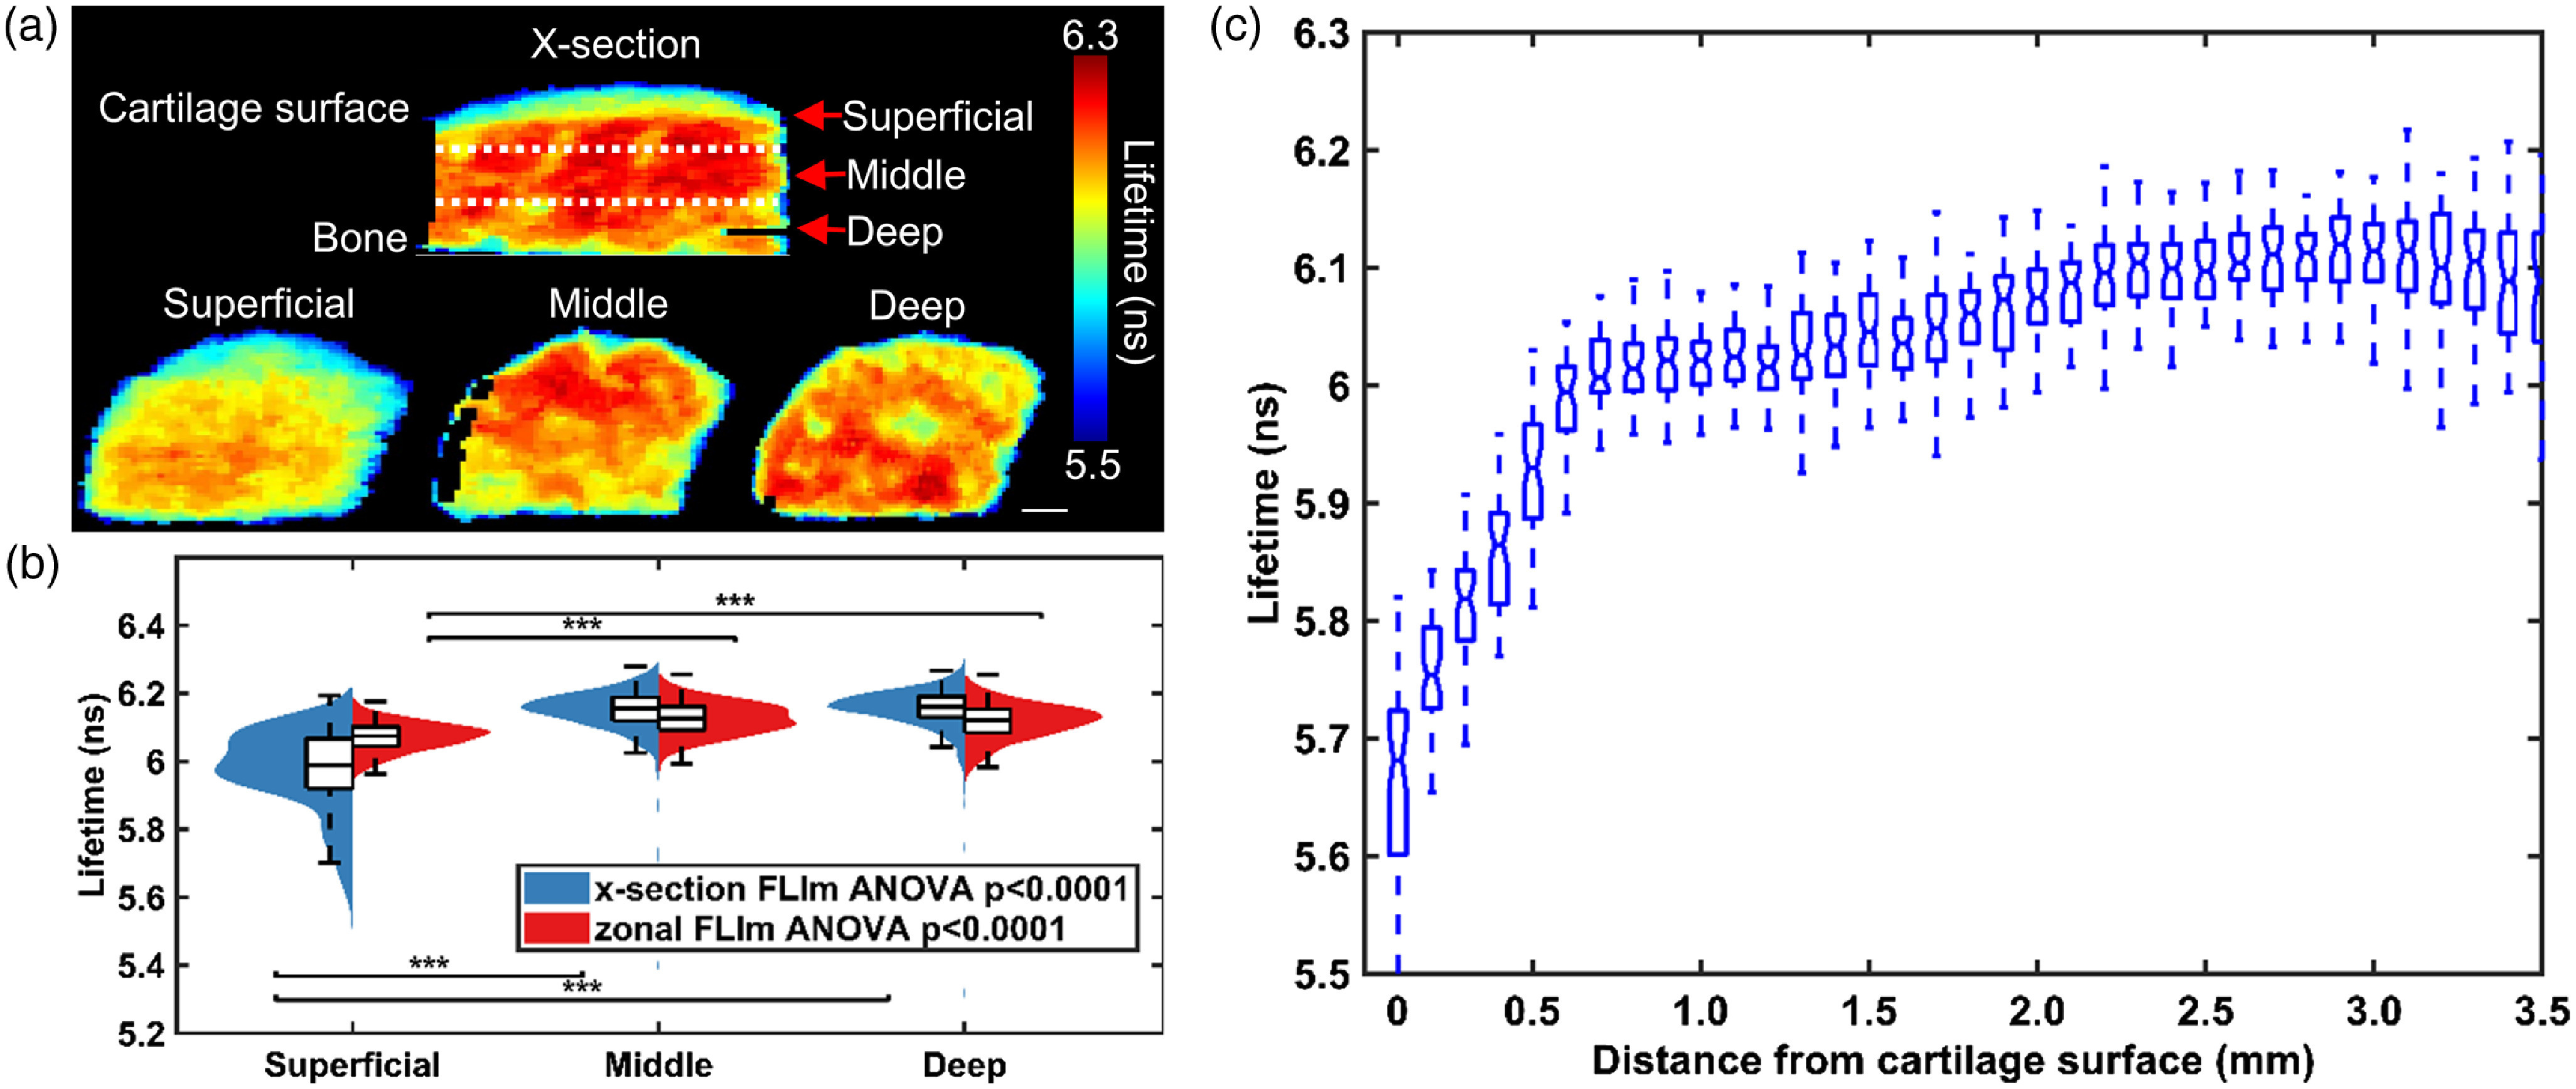
Fig. 2.

Channel 1 (375 to 410 nm) fluorescence LT increases with distance from articular cartilage surface (). (a) Representative cross-section and zonal FLIm image of native bovine articular cartilage. . Dashed line represents estimated location of cut of superficial, middle and deep zone. (b) Violin plot of LT distribution of different zones of articular cartilage acquired through zonal and -section imaging. The LT of superficial zone is significantly lower than that of middle and deep zones (***). (c) A box plot of average LT versus distance from cartilage surface for all samples (). Each box represents all data points from all samples at the corresponding distance from cartilage surface. Five values are highlighted: the extremes, the upper and lower quantiles, and the median. A clear increase of LT with distance from cartilage surface is observed. The increase is most prominent within the first 0.5 mm of cartilage surface.
