
Fig. 3.
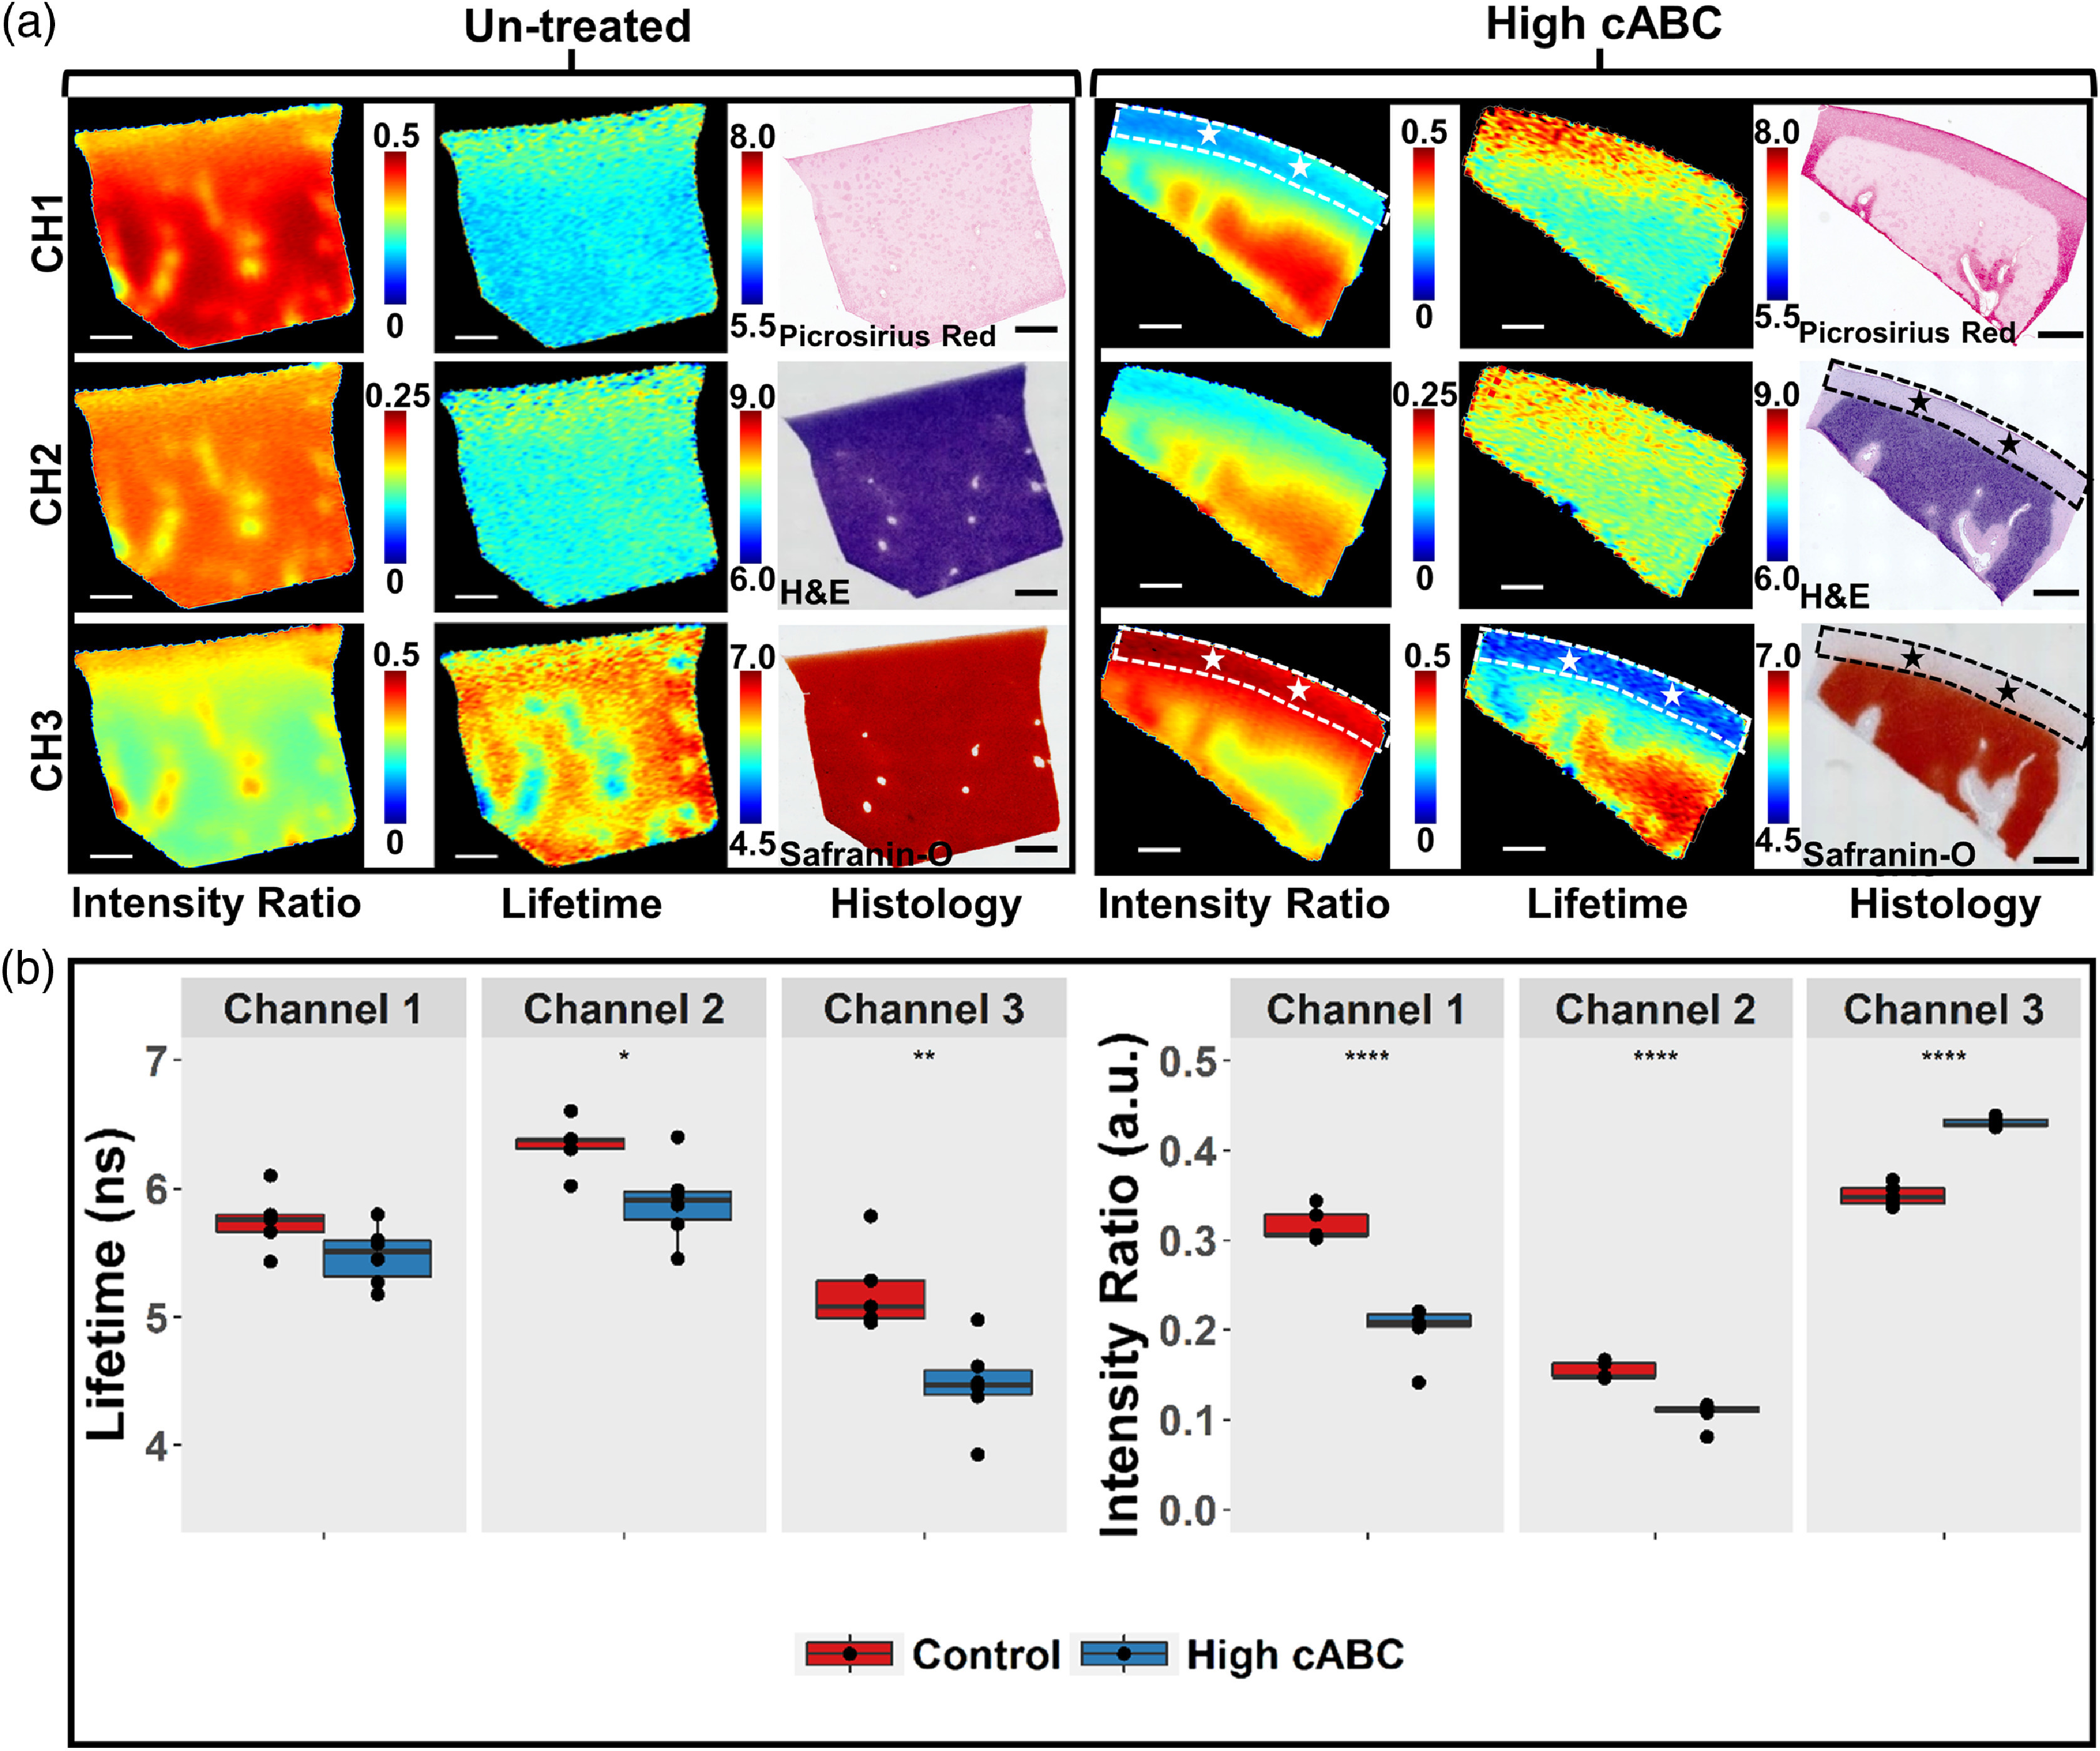
FLIm detects GAG depletion in articular cartilage. (a) Representative fluorescence cross-sectional intensity ratio images, LT images, and histology images of untreated and treated bovine articular cartilage. ROIs highlight the region of GAG depletion in histology images of cABC treated sample. The corresponding region in FLIm LT and intensity ratio images are highlighted by stars. The GAG depletion region appears in FLIm maps with higher intensity ratio and lower LT in channel 3 as well as lower intensity ratio in channel 1. No GAG depletion is observed for control sample. ( per group). (b) Box plot of ROI average LT from all samples in control and high cABC group. Significant LT differences are observed in channel 2 (450 to 485 nm) * and channel 3 (530 to 565 nm) **. Significant differences in intensity ratio are observed in all channels. ****.