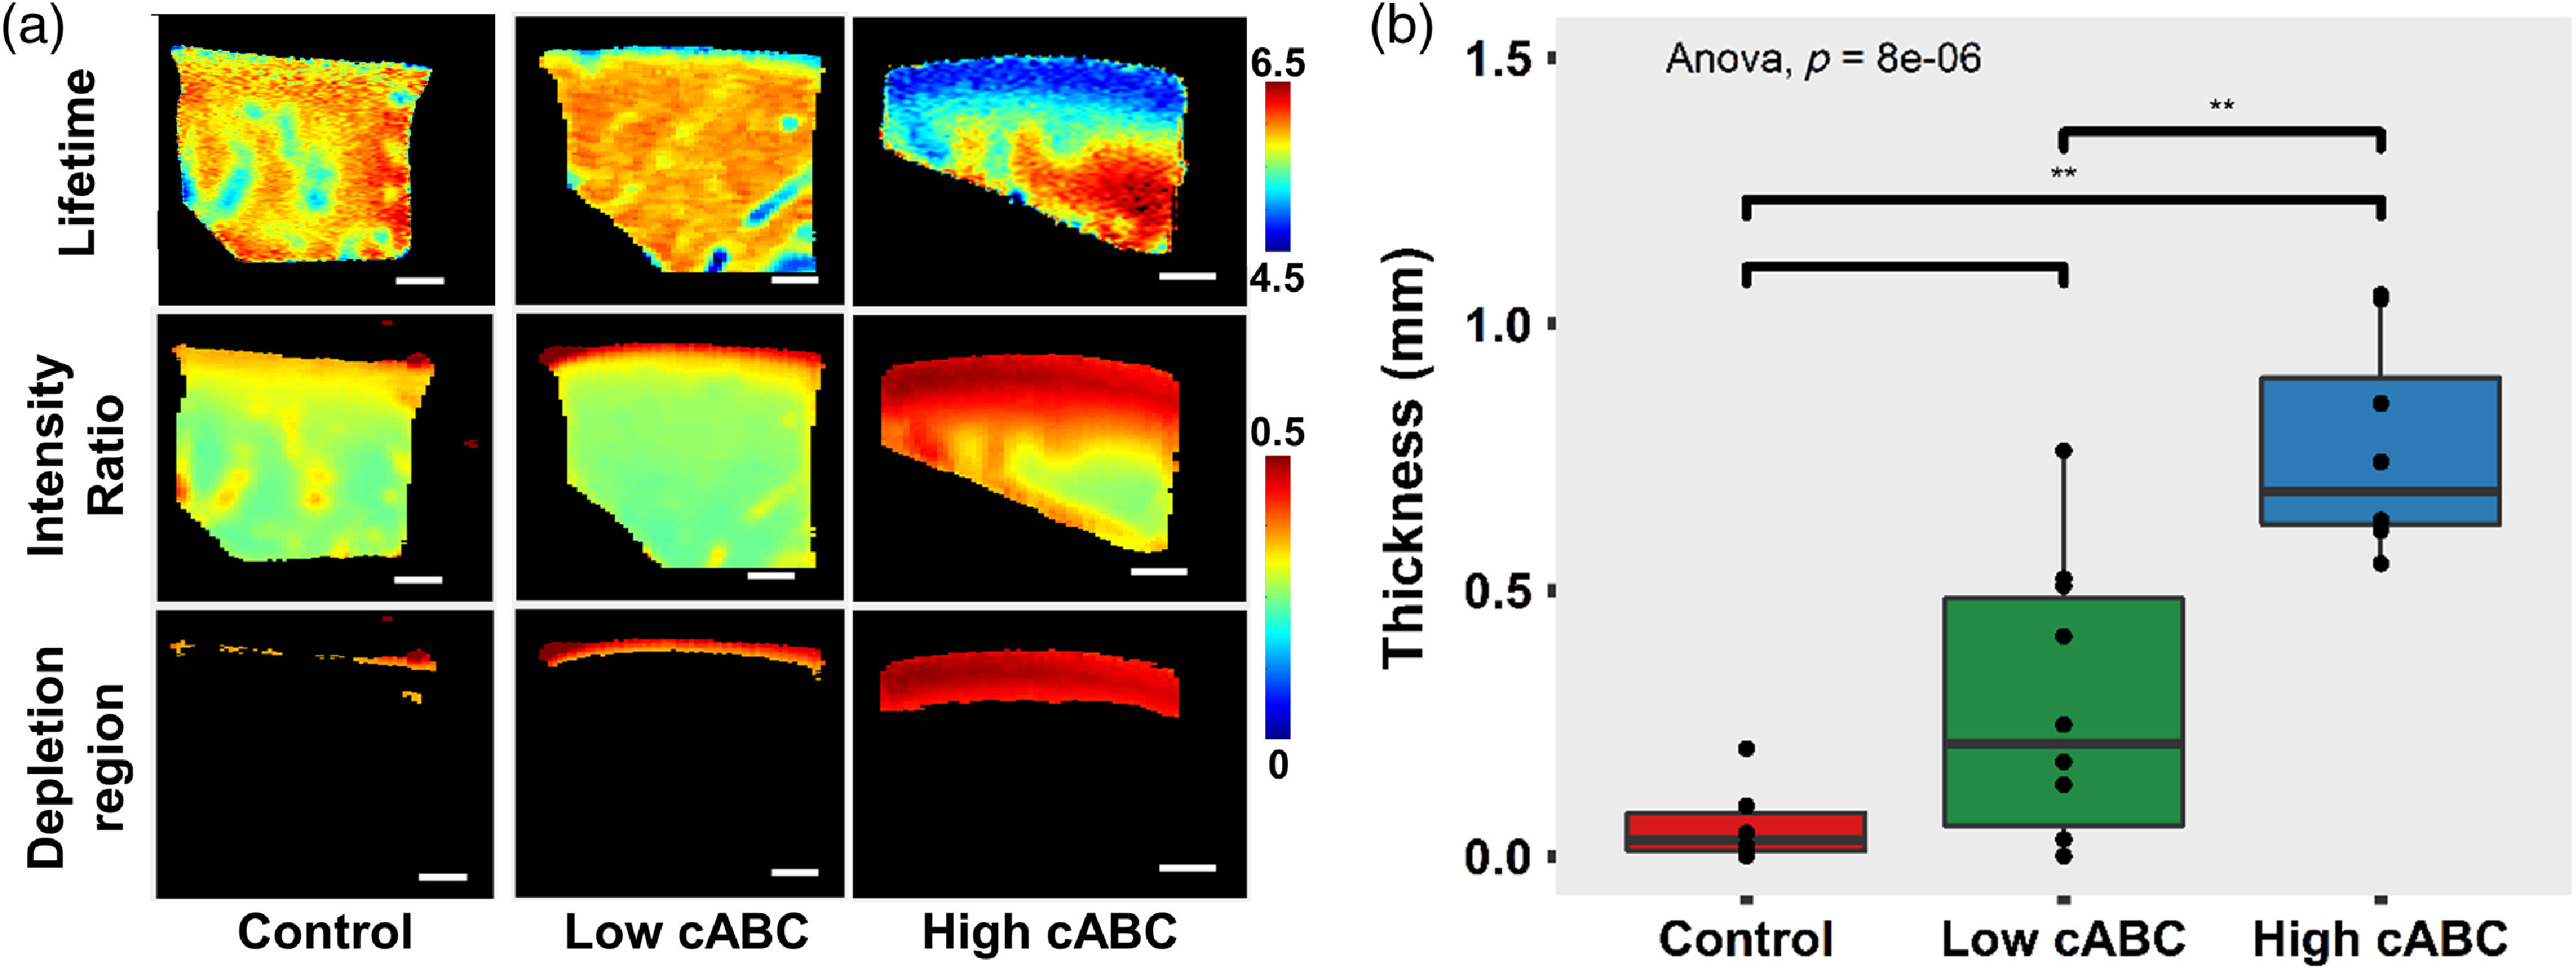
Fig. 4.

(a) Representative cross-sectional FLIm LT and intensity ratio images of cartilage without treatment and cartilage treated with high () and low () concentration of cABC. The depleted region is segmented using channel 1 intensity ratio of 0.25. . (b) Box plot of the thickness of the GAG depleted layer calculated from segmentation result ** ( per treatment group).
