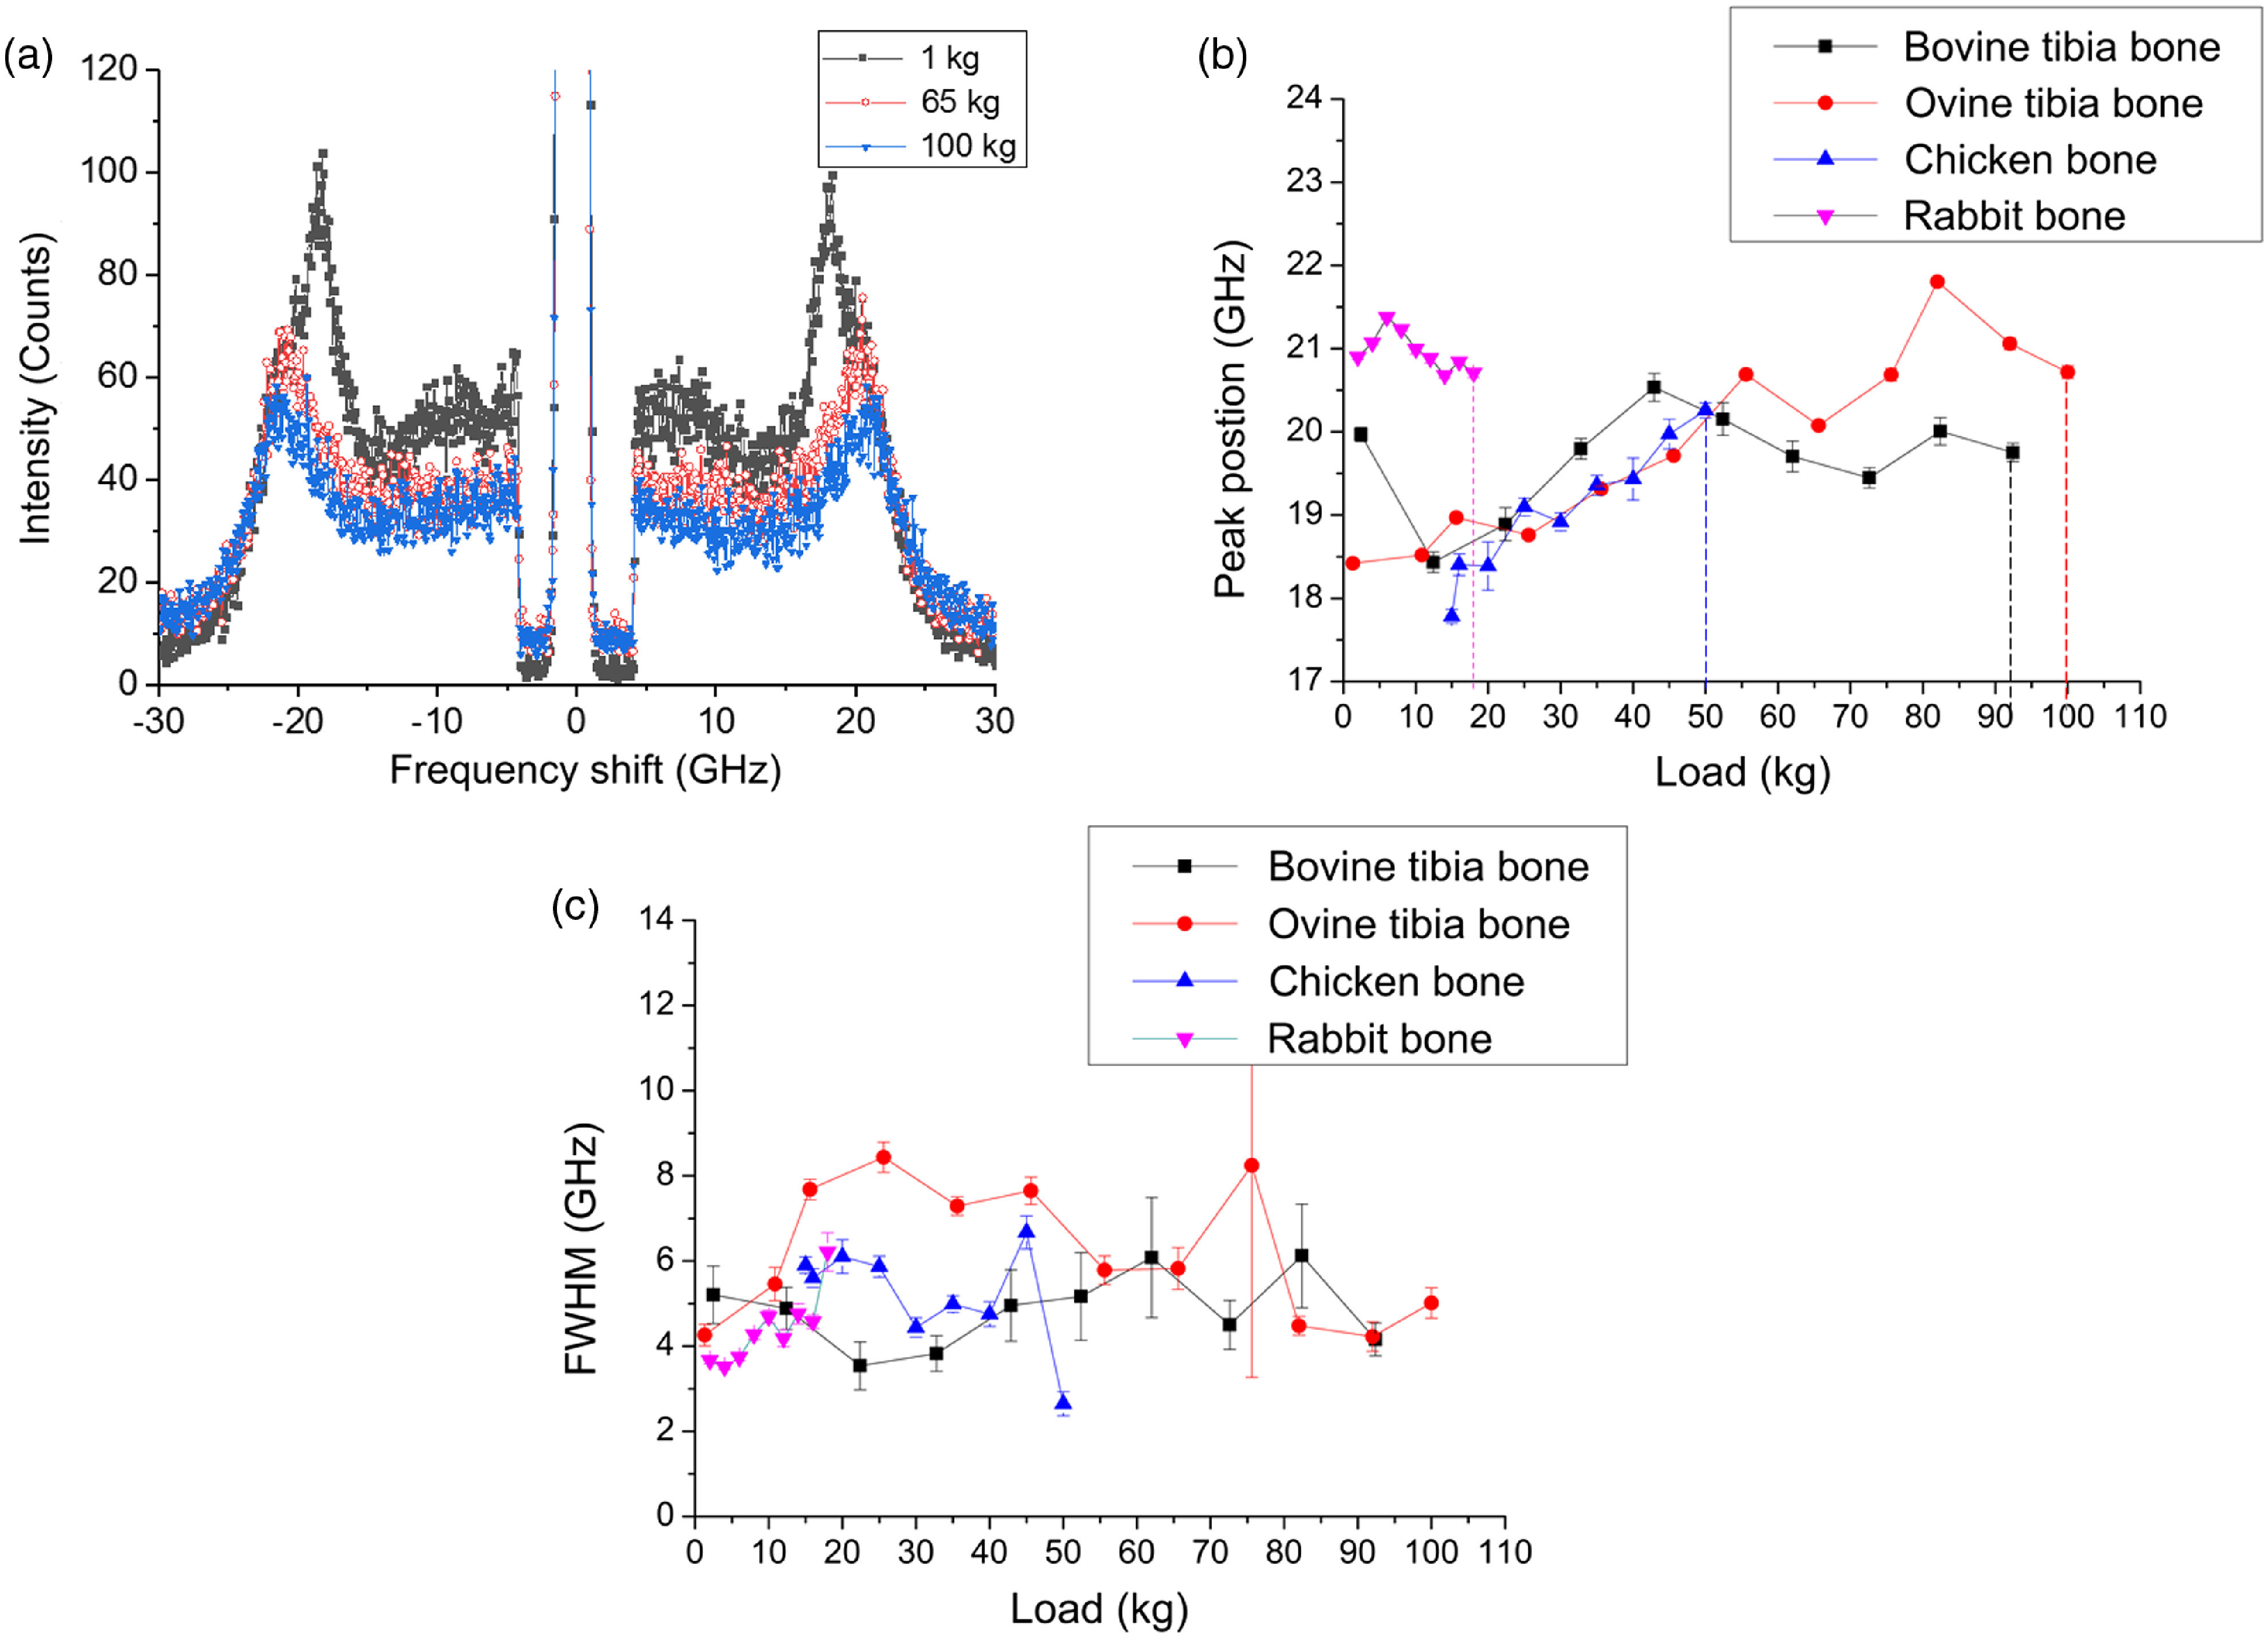
Fig. 4.

(a) Brillouin spectra acquired for the ovine tibia bone, (b) the Brillouin peak’ positions for bovine, ovine, chicken tibia, and ulna bones under the compression load. Error bars represent a 95% confidence interval based on the standard deviation. Corresponding breaking limits are shown with vertical dashed lines, and (c) FWHM obtained from the spectra as a function of compression load for bovine, ovine, chicken tibia, and rabbit ulna bones.
