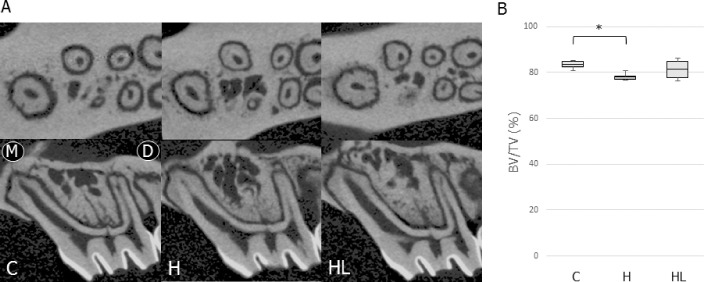
Figure 3.
(A) Images of IRAB in the M1 region of the control and experimental groups. Upper panel, horizontal view; lower panel, sagittal view, (B) Comparisons of BV/TV in the alveolar bone of M1 in the control and experimental groups. For this figure and Figures 4–6, the box edges represent the upper and lower quantiles, the middle lines in the boxes represent the mean, and the whiskers represent the maxima and minima. Abbreviations for this figure and Figures 4–6: C, normal occlusion group; H, occlusal hypofunction group; HL, occlusal hypofunction irradiated with LIPUS group. * P < .05.

