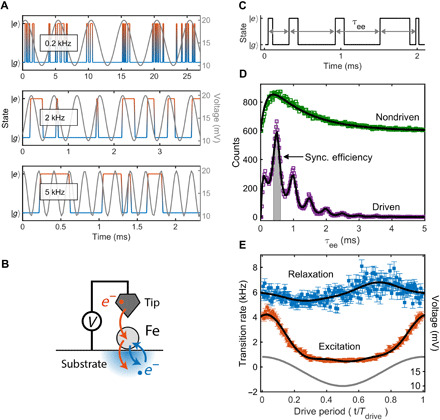
Fig. 2. Spin-state synchronization.

(A) Measured time traces of the atom’s spin state (blue to red) for different driving frequencies (Vac = 5 mV and Vset = 15 mV). (B) Schematic description of the scattering processes responsible for the excitation (red arrows) and relaxation (blue arrows) of the Fe atom’s spin state. (C) Schematic spin-state evolution with time (black line), with the time τee between excitation events shown with arrows. (D) Event histogram of τee for a constant bias voltage (nondriven, green) and for a driving harmonic signal with a frequency of 2 kHz (driven, purple). The ratio of gray-shaded counts to total counts is the synchronization efficiency. The histogram for the constant bias voltage case is fit with a hypoexponential function (black), while the histogram for the driven case (black) was calculated analytically using the rates in (C). (E) Time-dependent excitation (red) and relaxation (blue) rates are plotted over one period, and the black line is the fit used as input to the SR model (see Methods for details). The corresponding voltage is shown in gray. Tdrive = 0.5 ms, B = 500 mT, T = 0.5 K, Iset = 3 nA, Vset = 15 mV, and Vac = 5 mV.
