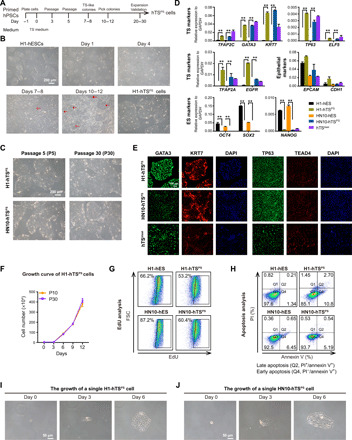
Fig. 1. Derivation of hTSPS cells from primed hPSCs.

(A) Overview of conversion strategy to generate hTSCs (hTSPS cells) from PSCs (hPSCs). hPSCs were maintained in mTeSR1 medium in monolayer culture. The TS-like colonies appeared at days 7 and 8 and were picked at days 10 to 12 for subculture expansion as purified hTSPS cells (see Materials and Methods). (B) Morphology of converted cells derived from H1 hESCs under TS medium. Scale bar, 200 μm. (C) Morphology of hTSPS cells derived from H1 or HN10 hESCs at early (P5) or late passage (P30). Scale bar, 200 μm. (D) Quantitative real-time polymerase chain reaction (qRT-PCR) expression of TS, epithelial, and ES marker genes in hTSPS cells derived from H1 or HN10 hESCs. H1 and HN10 hESCs serve as negative controls. hTSblast serves as a positive control. **P < 0.01. Error bars represent means ± SD from three independent replicates. Results represent two samples, H1-hTSPS and HN10-TSPS (n = 2). (E) Immunostaining of TS marker genes GATA3/KRT7/TP63/TEAD4 in hTSPS cells derived from H1 or HN10 hESCs. hTSblast serves as a positive control. Scale bar, 100 μm. (F) Growth curve of H1 hTSPS cells at early (P10) or high passage (P30). Error bars represent means ± SD from three independent replicates. Similar results were obtained using another independent cell line HN10-TSPS (fig. S2H). (G) EdU incorporation assay for hTSPS cells and their parent hESCs. (H) Apoptosis assay in hTSPS cells and their parent hESCs. PI and/or annexin V–positive cells were analyzed by fluorescence-activated cell sorting (FACS). The apoptotic cells include late apoptotic cells (PI+/annexin+) in Q2 and early apoptotic cells (PI−/annexin V+) in Q4. (I and J) Phase-contrast images showing growth of a single hTSPS cell. Scale bar, 50 μm. The results shown in (E), (G), and (H) are representative of three independent experiments from two samples, H1-hTSPS and HN10-TSPS (n = 2). See figs. S1 to S3 for more details.
