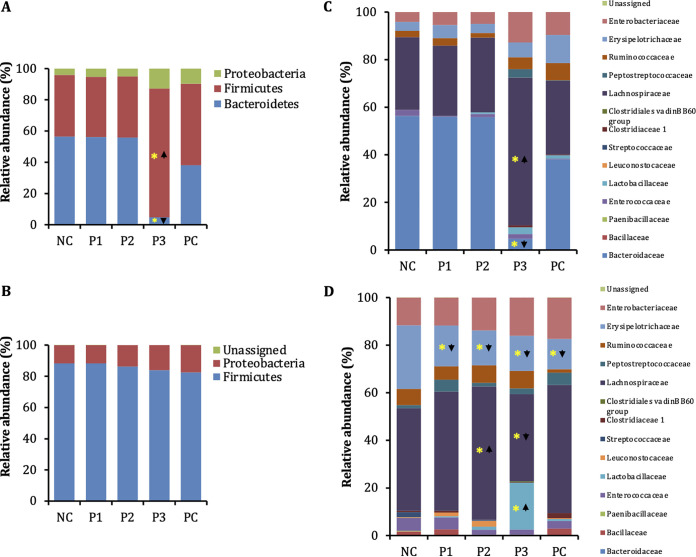
FIG 9.
Microbial relative abundance (at the phylum level) in ceca of chickens treated with peptides at 50-mg/kg (A) and 100-mg/kg (B) doses. NC, noninfected and nontreated chickens; PC, infected but not treated chickens. Microbial relative abundance (at the family level) in ceca of chickens treated with peptides at 50-mg/kg (C) and 100 mg/kg (D) doses. *, P < 0.05, Mann-Whitney U test.

