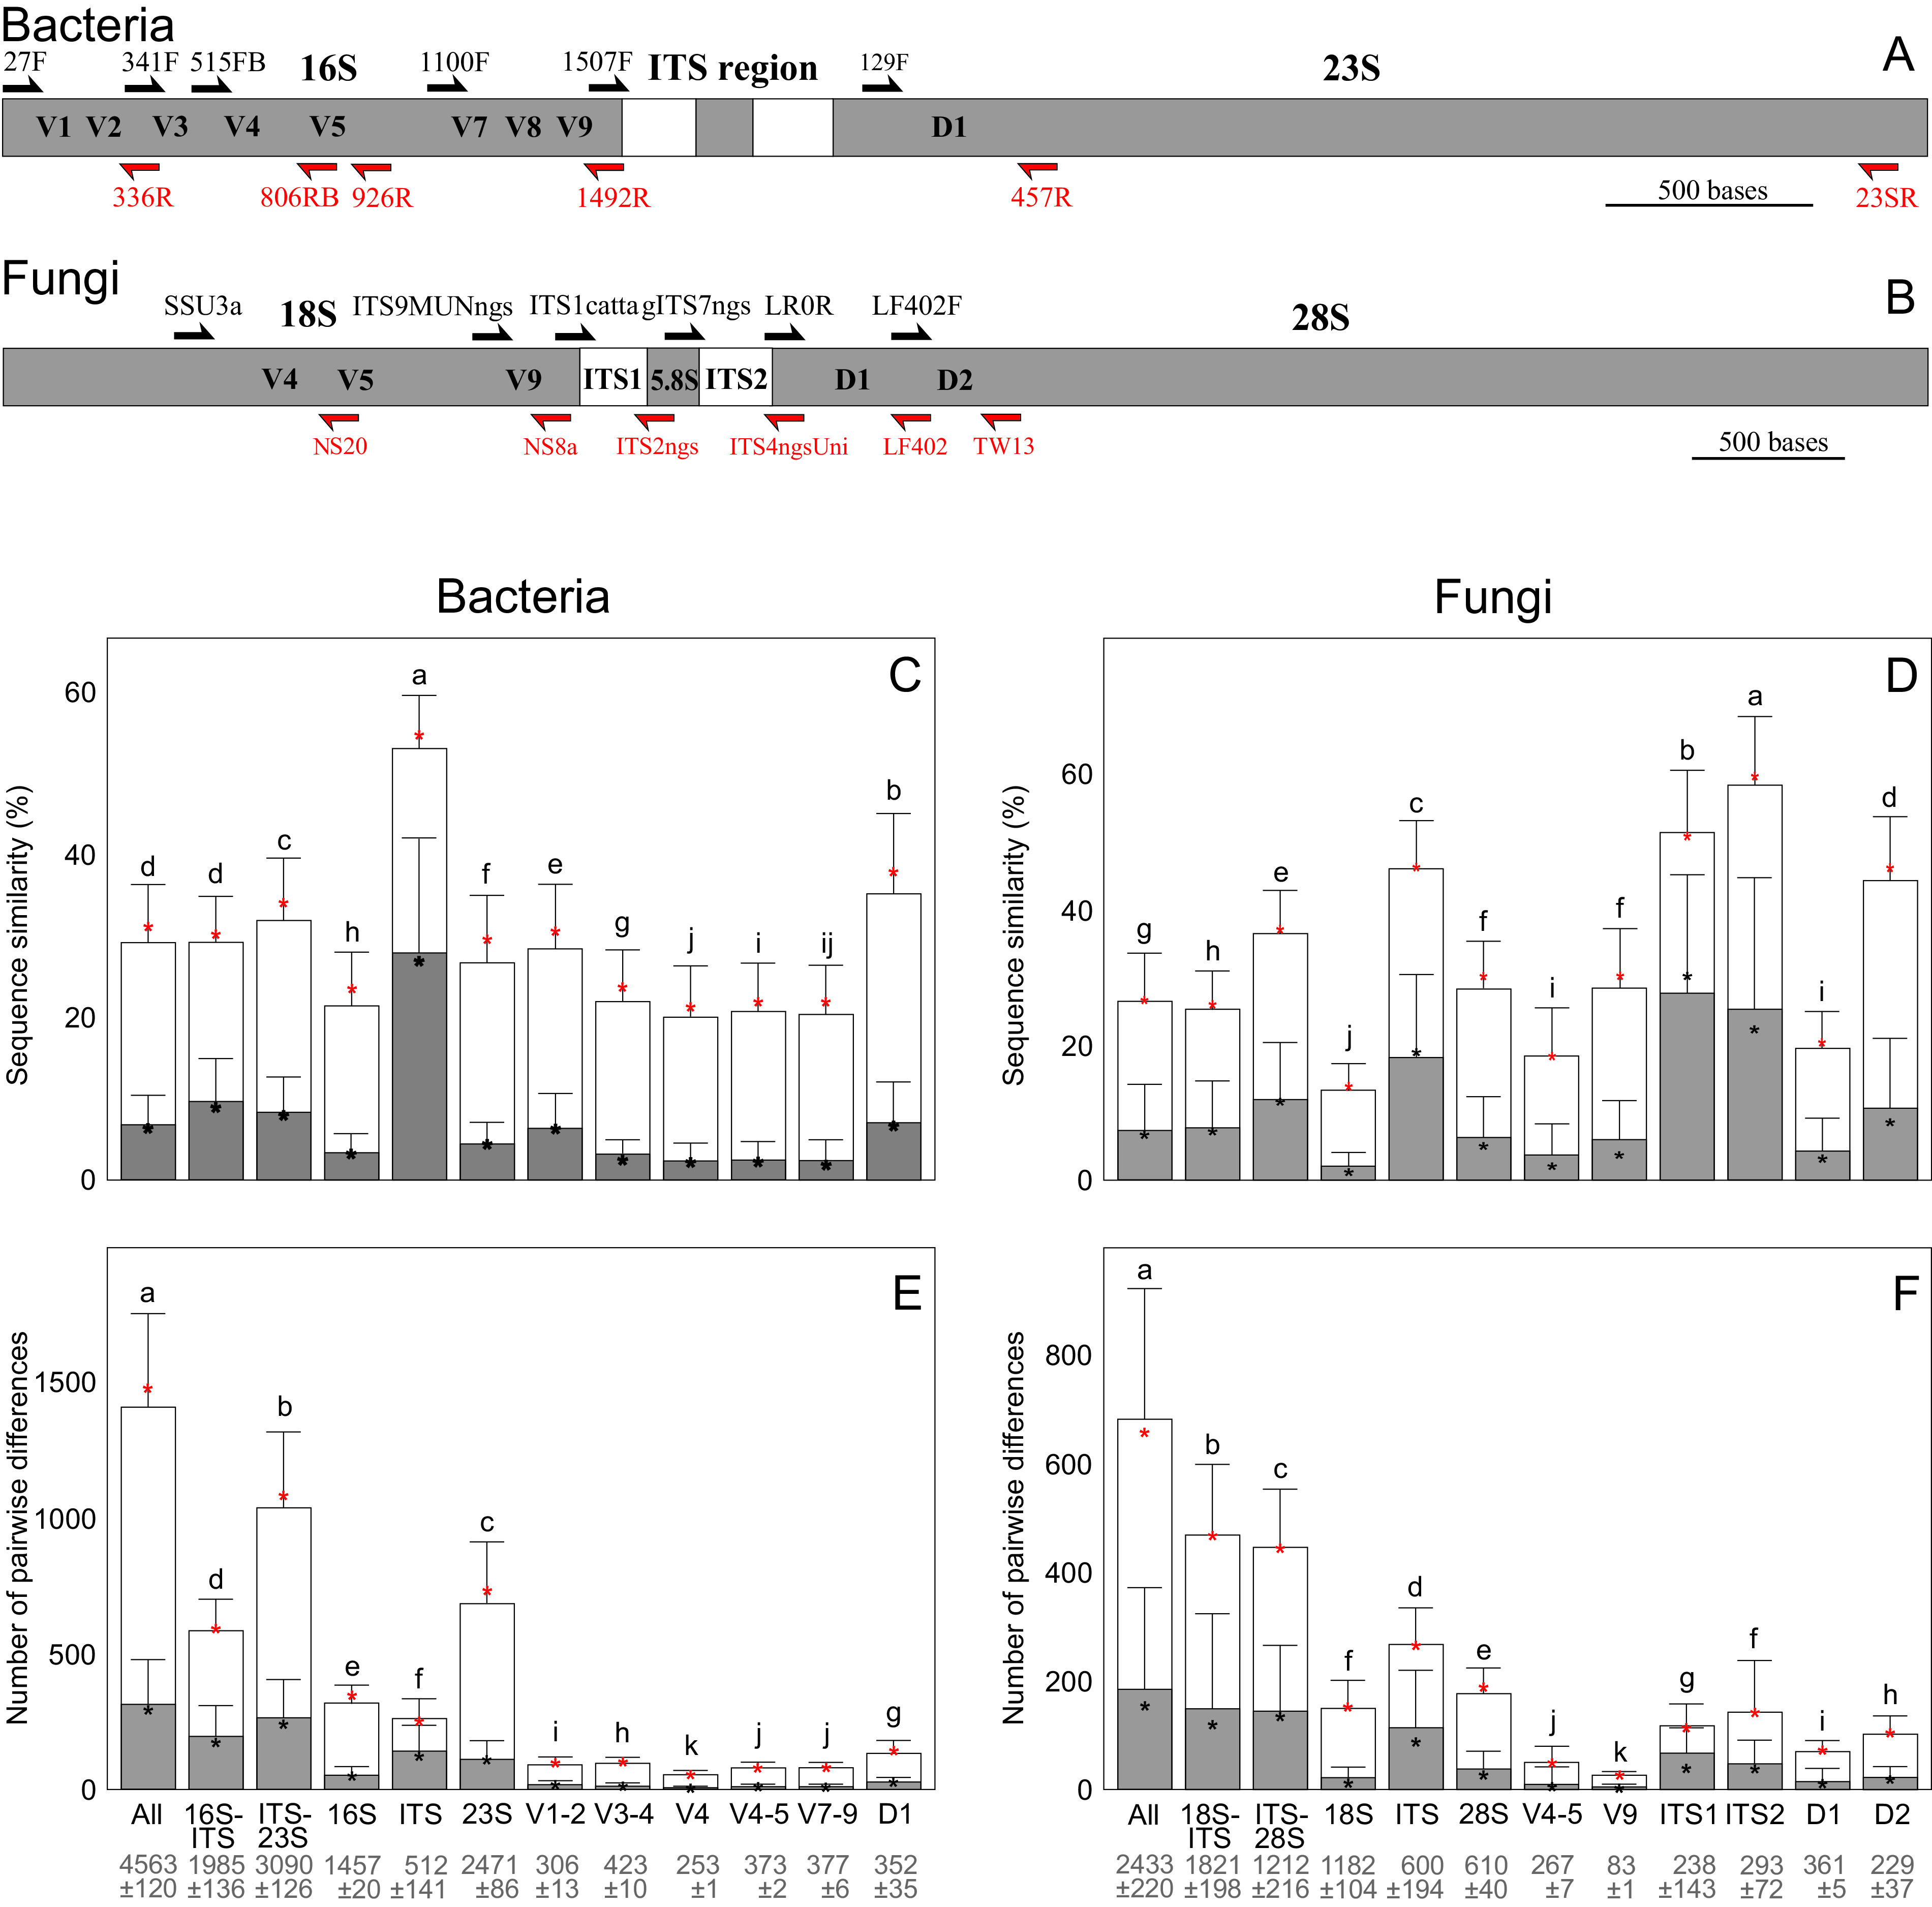
FIG 3.

Taxonomic resolution of rRNA marker gene fragments in short-read and long-read analyses. Distribution of taxonomic information in the rRNA operon of bacteria (A) and fungi (B). Relative sequence similarity (C, D) and number of mismatching nucleotides (E, F) in long-read and short-read rRNA gene sequence data of bacteria (left) and fungi (right) at the level of kingdom (open columns) and genus (shaded columns) based on pairwise alignments of fragments. The values are given as mean (box) ± standard deviation (whiskers) and median (asterisk). Different letters above bars depict statistically significant differences among groups (Padj < 0.001). Mean fragment length ± standard deviation is indicated below the fragments. The methods of calculating distances are outlined in Item S1 in the supplemental material.
