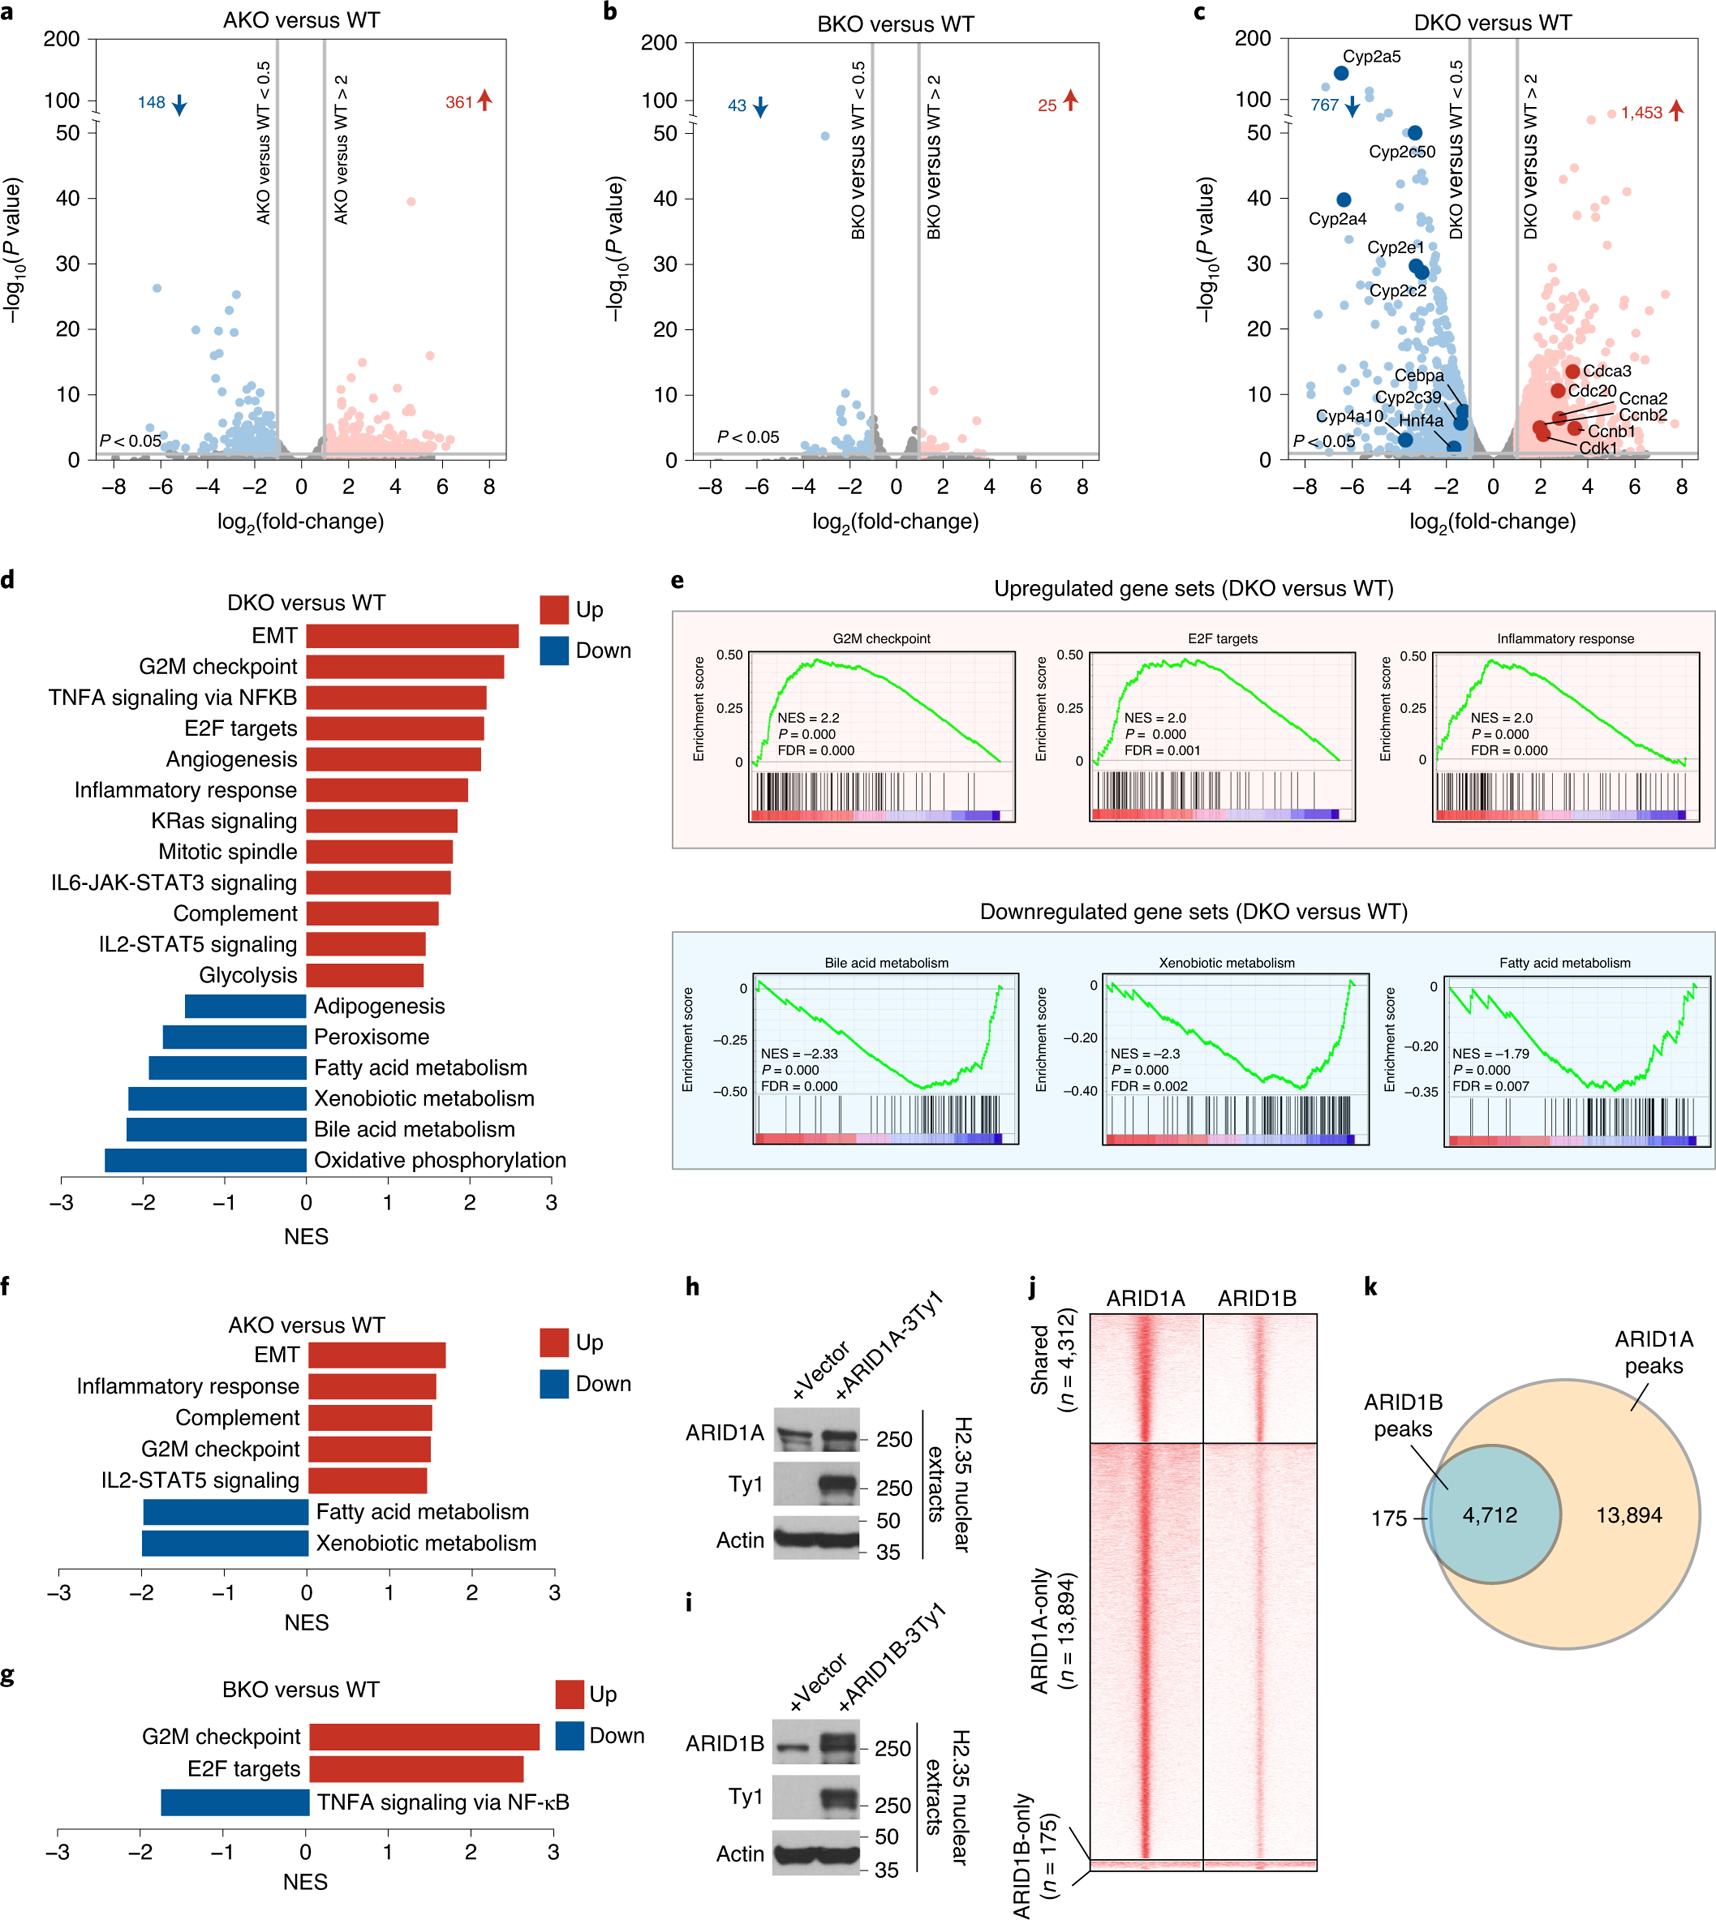
Figure 2. Loss of ARID1A and ARID1B in the liver leads to hyperproliferation and de-differentiation.

A–c. Volcano plots of RNA-seq data showing gene expression changes in AKO (a), BKO (b), DKO (c) and corresponding WT livers (n=4 and 4 mice for each group. ARID1Af/f; ARID1Bf/f, or double floxed mice without Albumin-Cre were used as controls). The dots/genes above the horizontal gray line at the bottom have P values of less than 0.05. P-values were calculated using DESeq R package which implements the negative binomial test and have been adjusted for multiple comparisons.
d. Hallmark pathway enrichment analysis of RNA-seq from WT and DKO livers.
e. GSEA performed on RNA-seq from DKO versus WT livers (NES: normalized enrichment score; FDR: false discovery rate).
f. Hallmark pathway enrichment analysis of RNA-seq from WT and AKO livers.
g. Hallmark pathway enrichment analysis of RNA-seq from WT and BKO livers.
h. Expression of Ty1 tagged ARID1A in H2.35 liver cells.
i. Expression of Ty1 tagged ARID1B in H2.35 liver cells.
j. Heatmap displaying ChIP-seq binding peaks of ARID1A and ARID1B (n=2 independent ChIP experiments for each).
k. Venn diagram showing the shared and unique binding loci between ARID1A and ARID1B.
