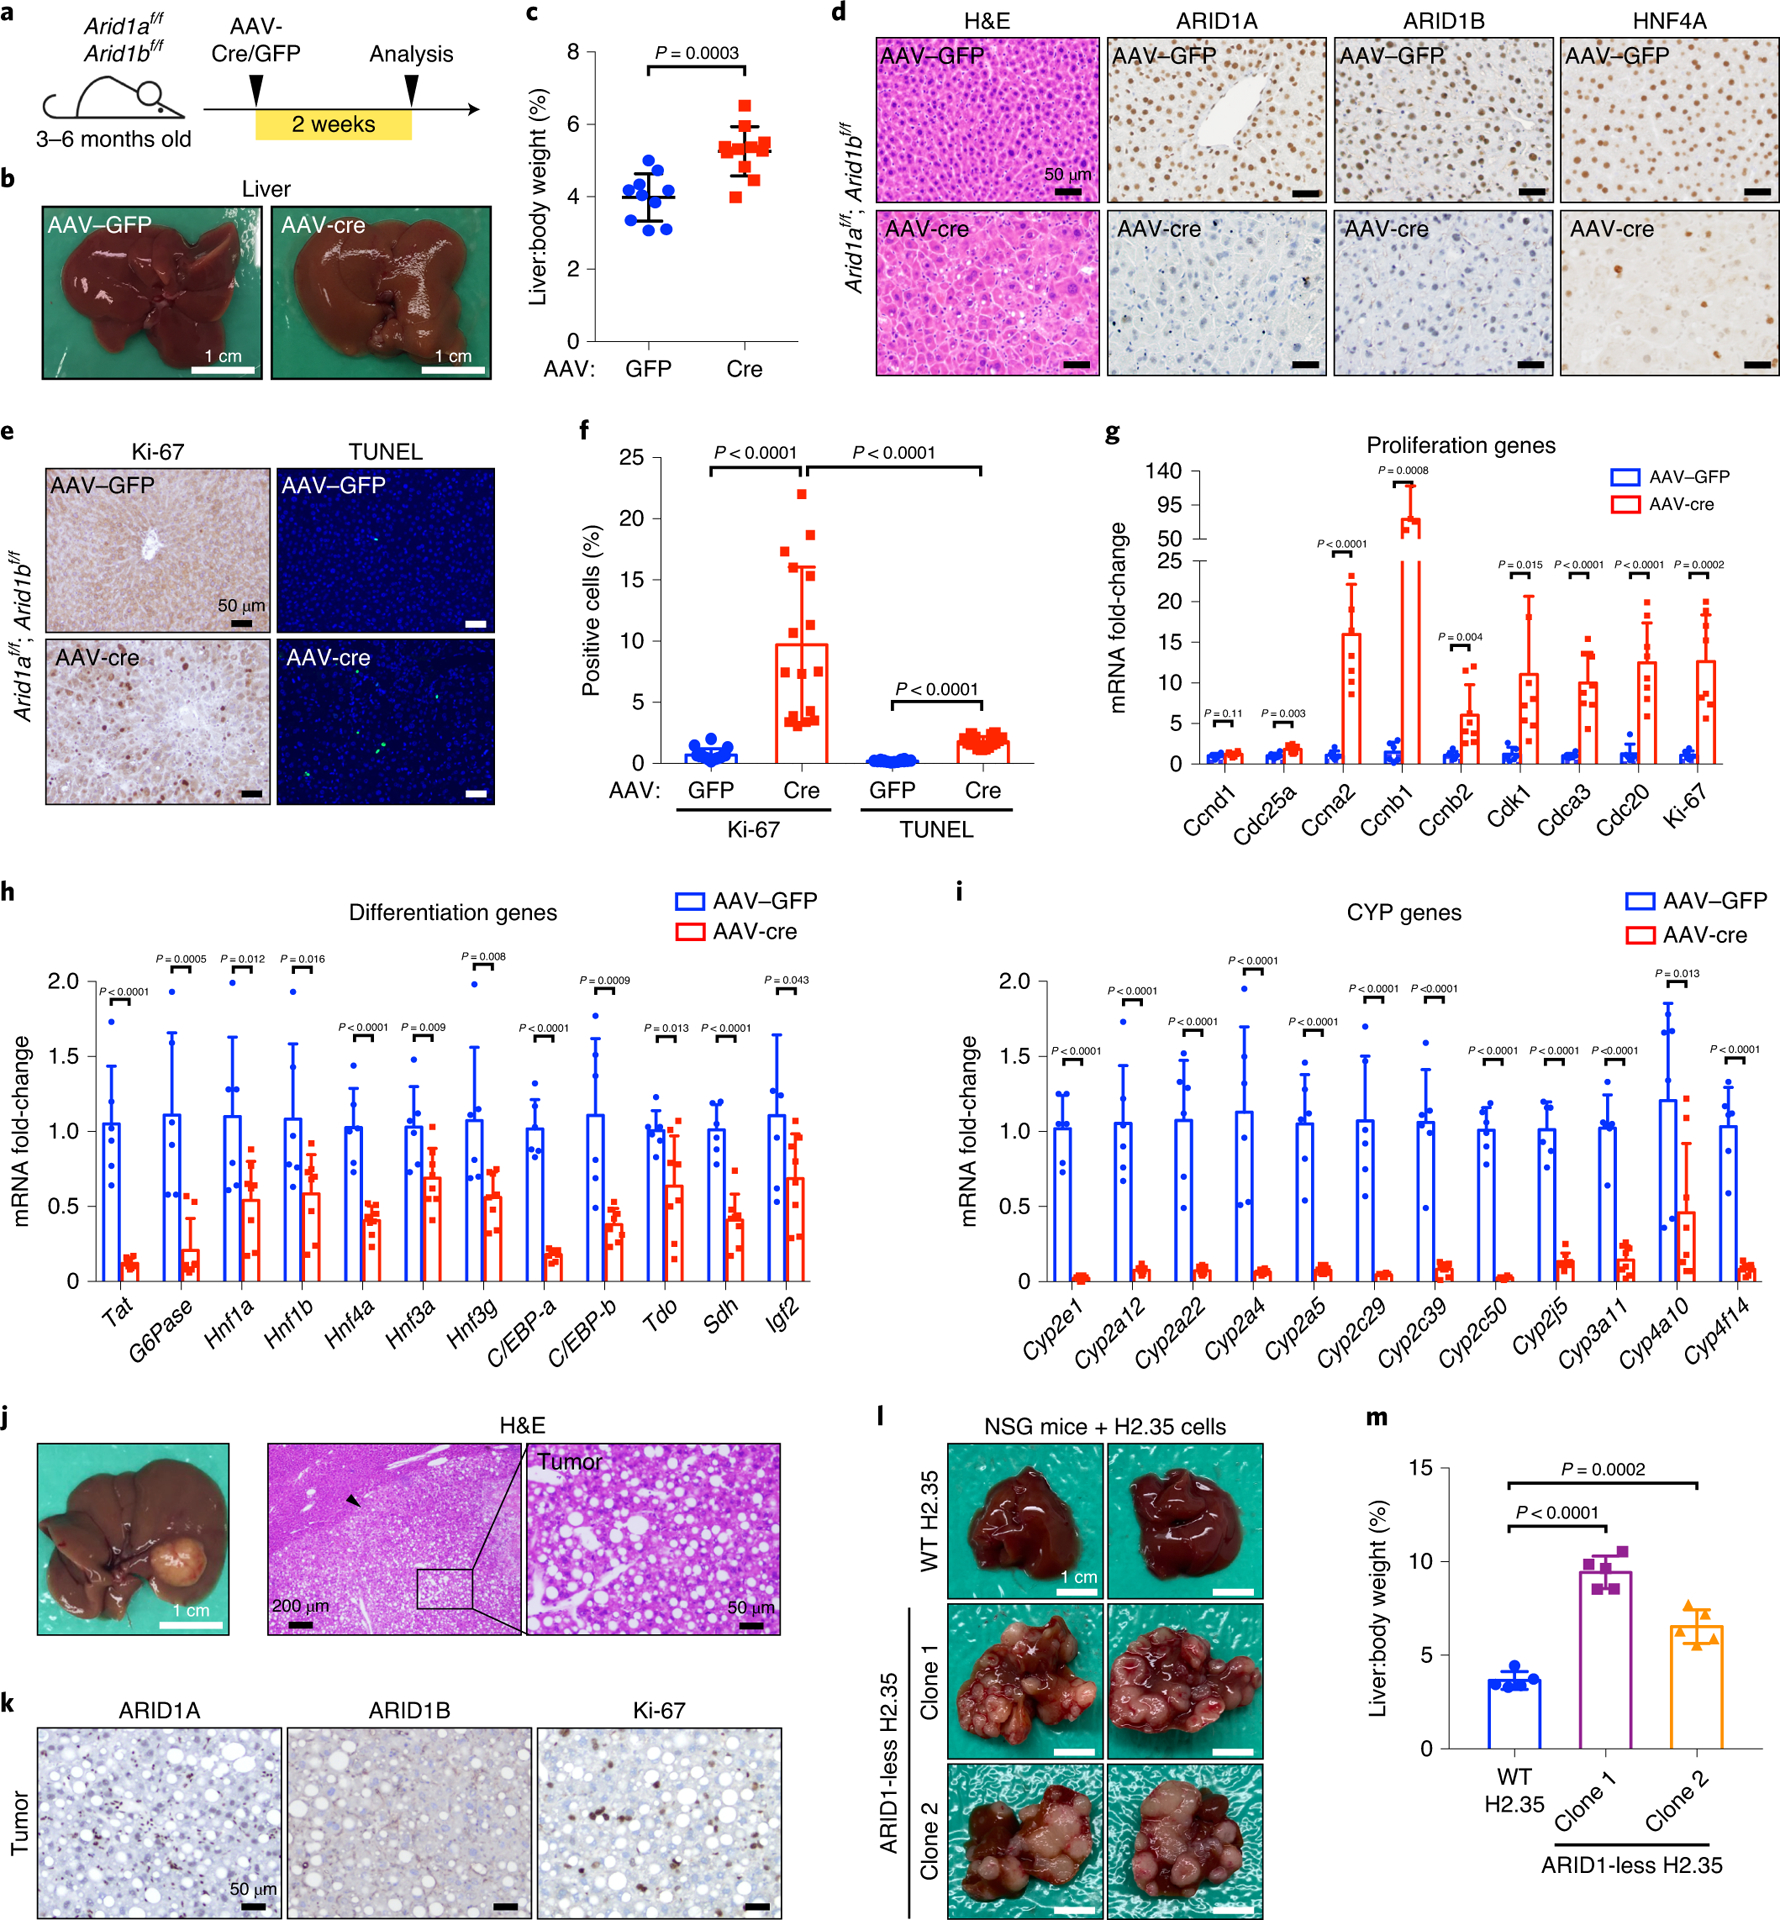
Figure 3. Hyperproliferation and de-differentiation are immediate effects after ARID1A/1B loss.

a. Schematic for AAV-Cre based KO of ARID1A/1B
b. Livers of Arid1af/f; Arid1bf/f mice injected with AAV-GFP or AAV-Cre.
c. Liver versus body weight of mice injected with AAV-GFP or AAV-Cre (n=10 and 11 mice).
d. H&E and IHC staining of ARID1A, ARID1B and HNF4A on AAV-Cre or GFP liver sections.
e. Proliferation and apoptosis were examined in AAV-GFP or Cre livers by IHC staining of Ki-67 and TUNEL.
f. Statistics of the positively staining cells in e (n = 8 and 8 mice for each group. Two images for each liver were analyzed).
g. qPCR analysis of proliferation related gene expression in AAV-GFP or AAV-Cre injected livers (n=6 and 8 mice for each group).
h. qPCR analysis of differentiation related gene expression in livers. Same samples and statistical analysis as in g.
i. qPCR analysis of Cytochrome P450 genes in livers. Same samples and statistical analysis as in g.
j. Representative liver images of Arid1af/f; Arid1bf/f mice injected with AAV-Cre at the age of 3 months and analyzed 8 months after injection. Histology was consistent with HCC.
k. IHC staining of ARID1A, ARID1B, and Ki-67 on AAV-Cre liver sections.
l. Representative liver images of NSG mice injected with control and ARID1-less H2.35 cells.
m. Liver versus body weight of NSG mice injected with WT and ARID1-less H2.35 cells (n=5 mice for each cell line transplantation). Data are presented as mean ± SD (c,f–i,m). Statistical significance was determined by two-tailed unpaired Student’s t-tests with Welch’s correction (c,f–i,m).
