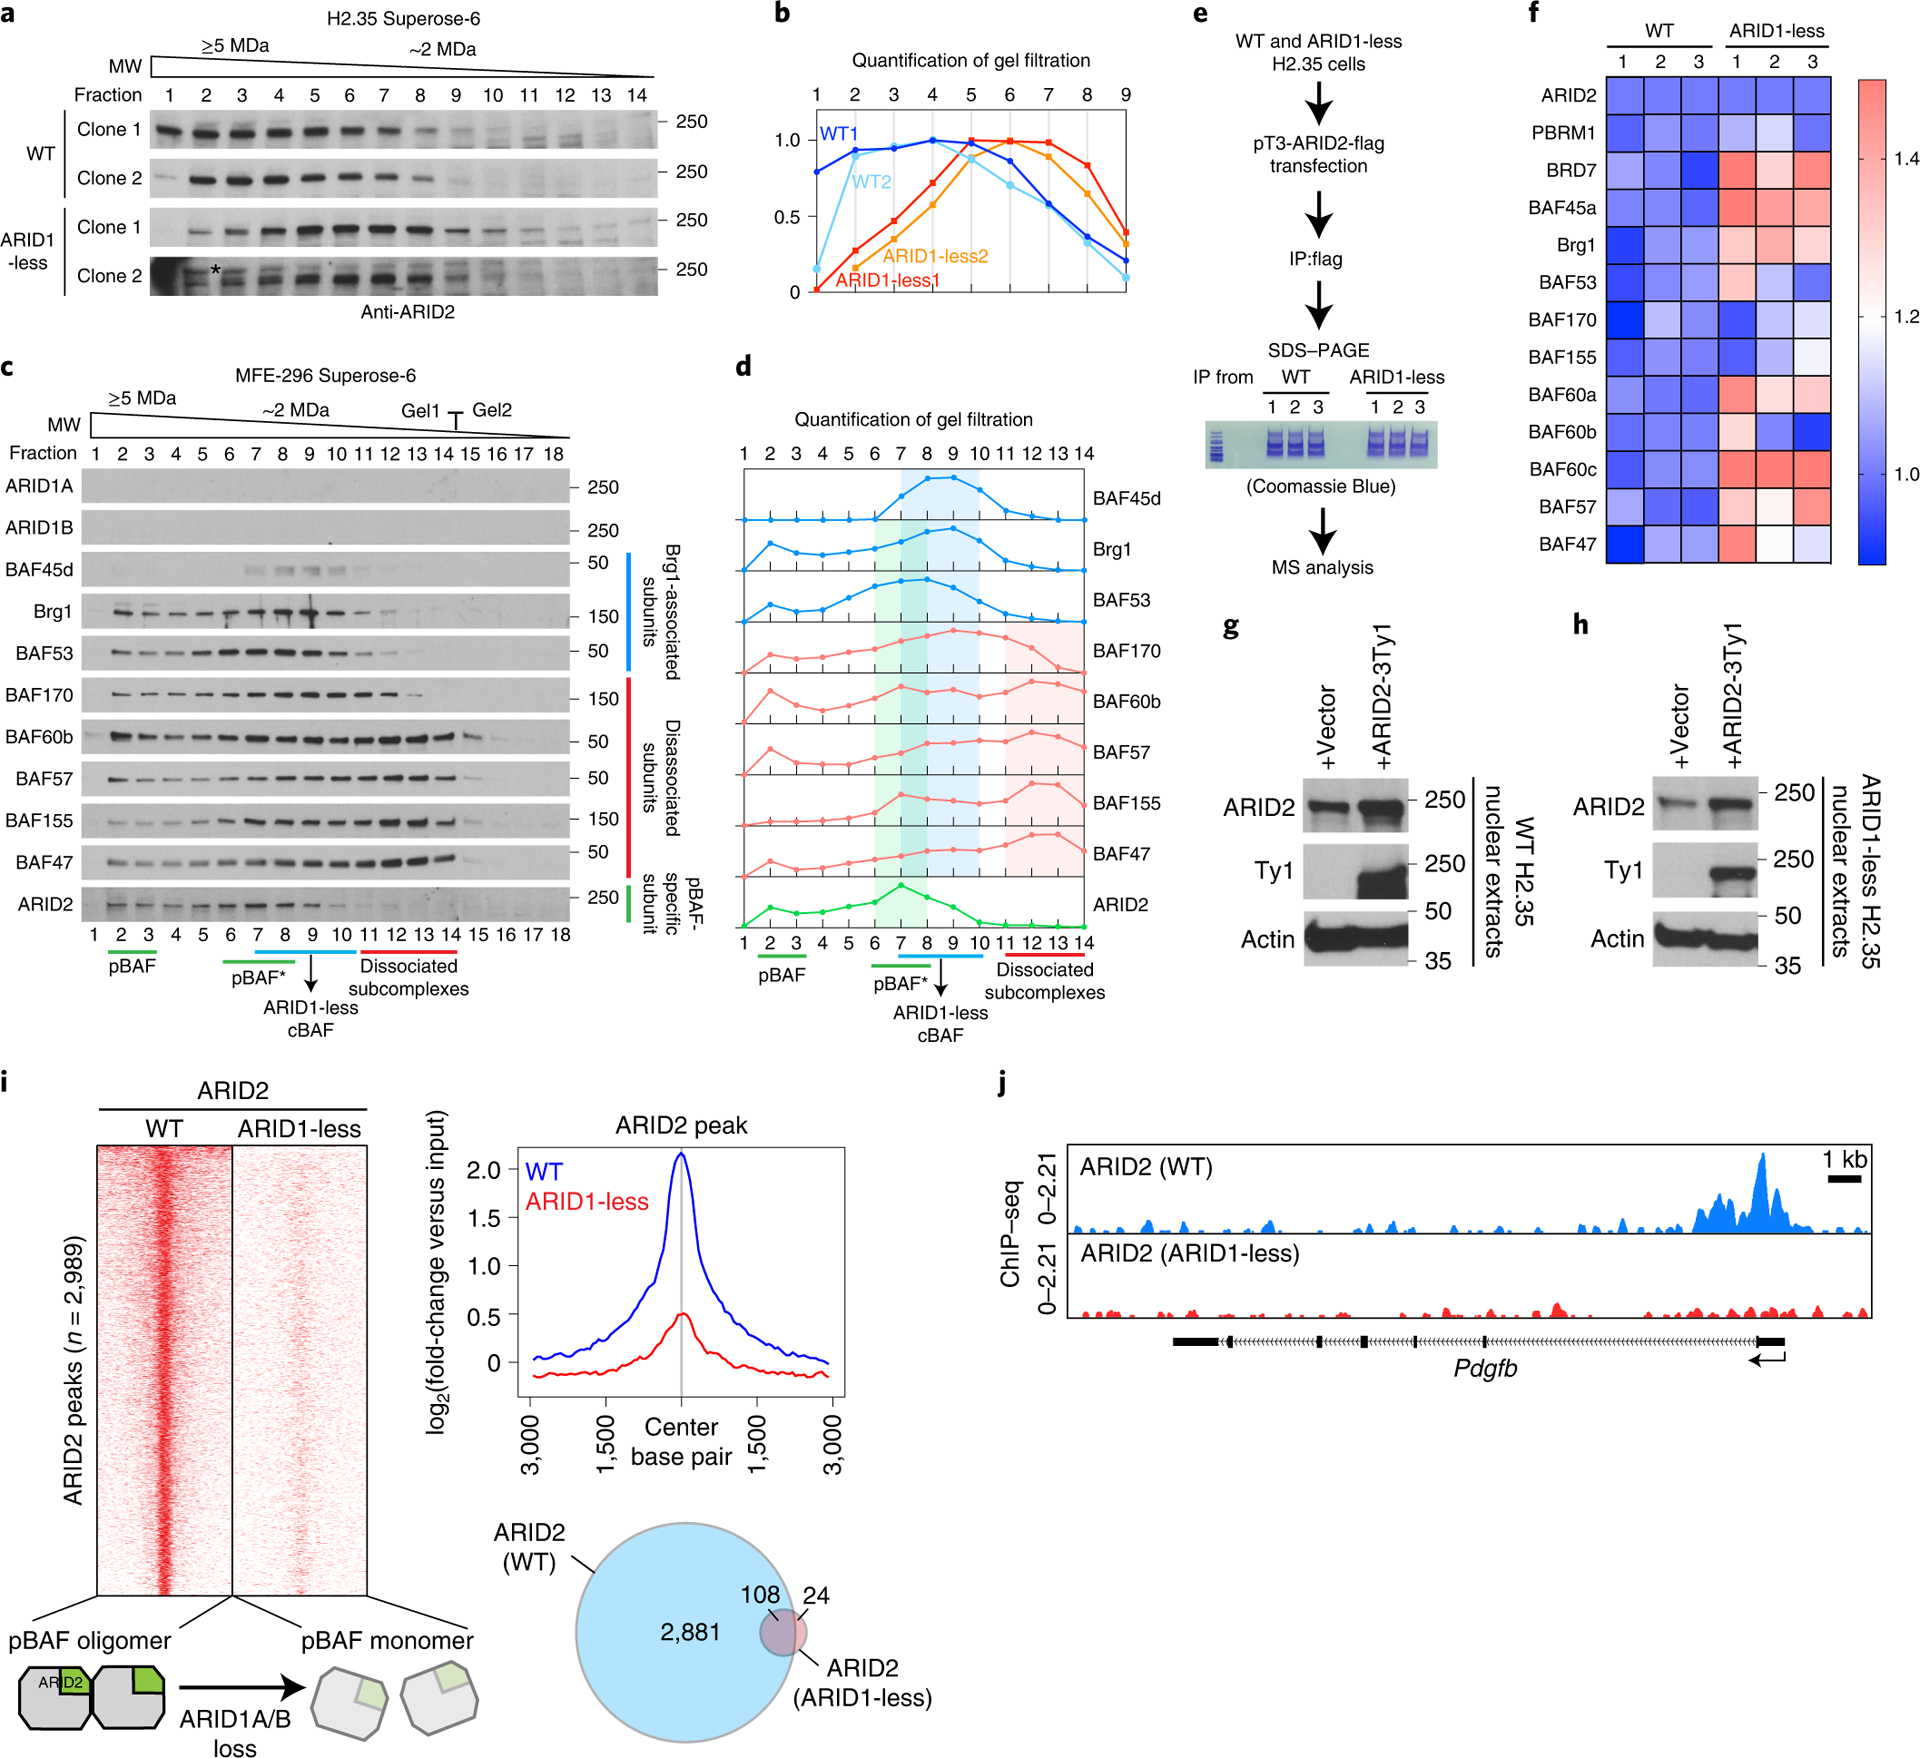
Figure 7. The presence of residual cBAF subcomplexes is associated with pBAF disruption.

a. Western blot for ARID2 in gel filtration chromatography experiments on control and ARID1-less H2.35 nuclear extracts from independent cell line clones (* non-specific band).
b. Quantification of western blot data in a.
c. Gel filtration chromatography of MFE-296 nuclear extracts using a Superose-6 column showing breakup of cBAF and two peak sizes for pBAF.
d. Quantification of western blot data in c.
e. Schema for mass spectrometry analysis of pBAF composition.
f. Mass spectrometry of pBAF complex purified from control and ARID1-less H2.35 cells. Relative quantity of each subunit was shown as heatmap (n=3 and 3 independent IP and mass spectrometry experiments). ARID2 levels in WT and ARID1-less cells were normalized to each other, and the other subunits were normalized by comparing their relative levels with ARID2.
g. Expression of Ty1 tagged ARID2 in control H2.35 cells.
h. Expression of Ty1 tagged ARID2 in ARID1-less H2.35 cells.
i. Comparison of ARID2 occupancies in control and ARID1-less cells. Heatmap and the corresponding averaged peak map and Venn diagram are shown (n=2 and 4 independent ChIP experiments).
j. Representative genome browser tracks showing impaired binding of pBAF (ARID2 peaks in ARID1-less cells).
