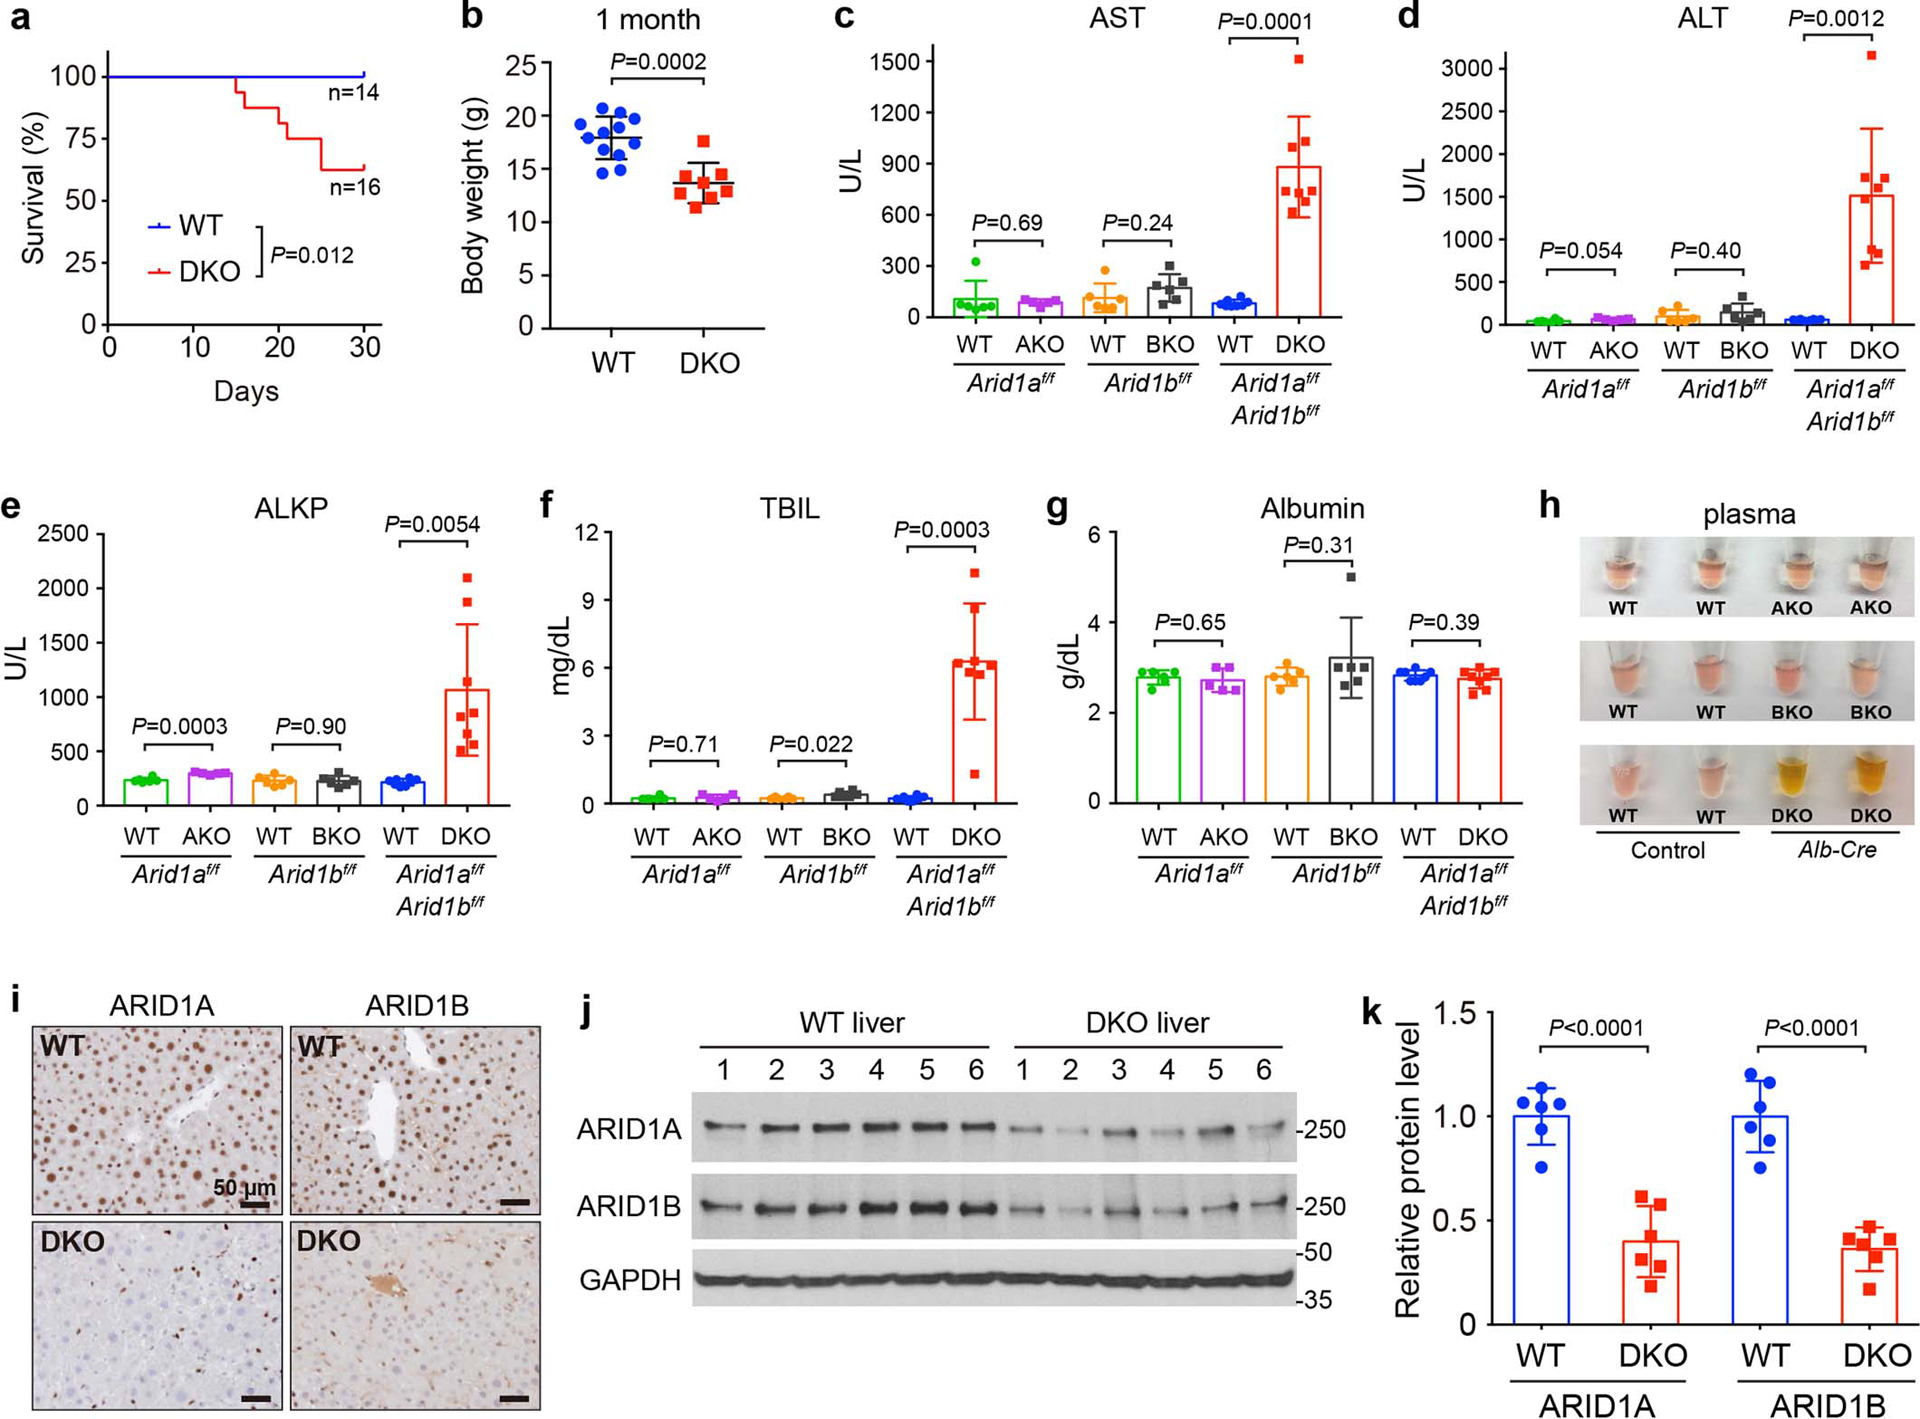
Extended Data Fig. 1. Loss of both ARID1A and ARID1B in the liver leads to impaired liver function.

a. Kaplan-Meier survival curve of WT and DKO mice within the first month of life.
b. Body weight of WT and DKO mice at the age of 1 month (n=12 and 8 mice).
c–g. Liver function analysis using plasma (n=6 and 5 mice for the Arid1af/f group; 6 and 6 for the Arid1bf/f group; 8 and 8 for the Arid1af/f; Arid1bf/f group).
h. Gross inspection of plasma from AKO, BKO and DKO and their corresponding WT mice.
i. IHC staining of ARID1A and ARID1B on WT and DKO liver sections.
j. Western blot showing ARID1A and ARID1B protein levels in WT and DKO livers.
k. Quantification of Western blot data in j (n=6 and 6 mice for each group).
Data are presented as mean ± SD (b–g,k).
Statistical significance was determined by two-tailed unpaired Student’s t-tests with Welch’s correction (b–g,k).
