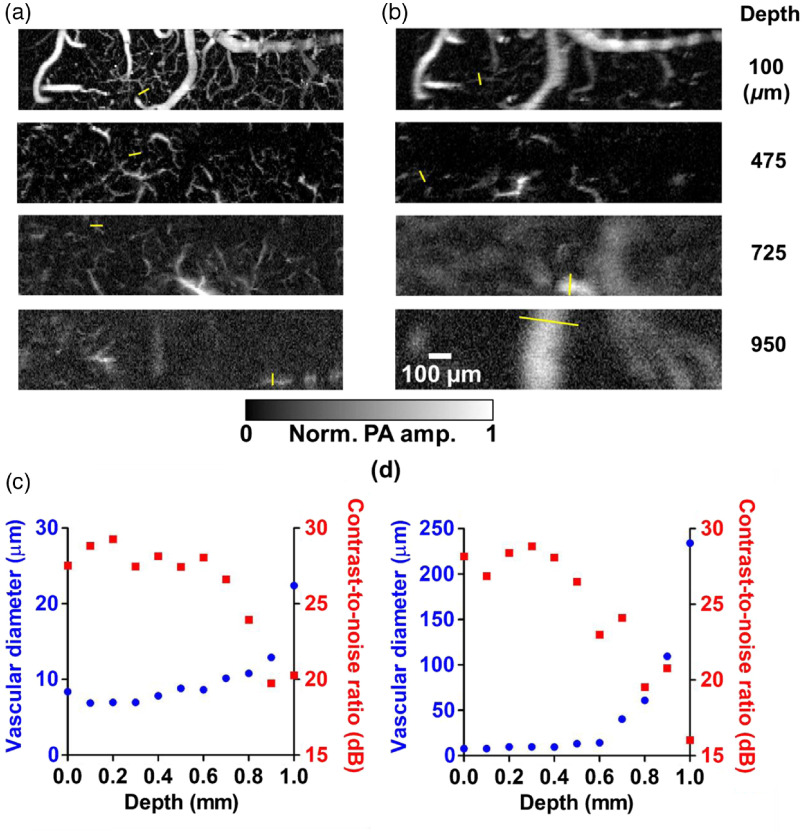
Fig. 8.
Maximum amplitude projection (MAP) images at different depths in a mouse brain acquired in vivo, and analysis of vascular diameters. The top illumination image in (a) displays more features than the oblique illumination image (b). The oblique illumination images start to blur at a shallower depth than the top illumination images because the lateral resolution is degraded by optical scattering due to the longer optical path length of the oblique illumination beam in the brain tissue. The depth-dependent lateral resolutions (shown in blue points) were characterized by picking out the smallest vessels within the field of view of the top illumination images (c) and the oblique illumination images (d), as illustrated by the yellow bars in (a) and (b). The corresponding estimated contrast-to-noise ratios (CNRs) around the sampled regions are shown in red squares in (c) and (d).

