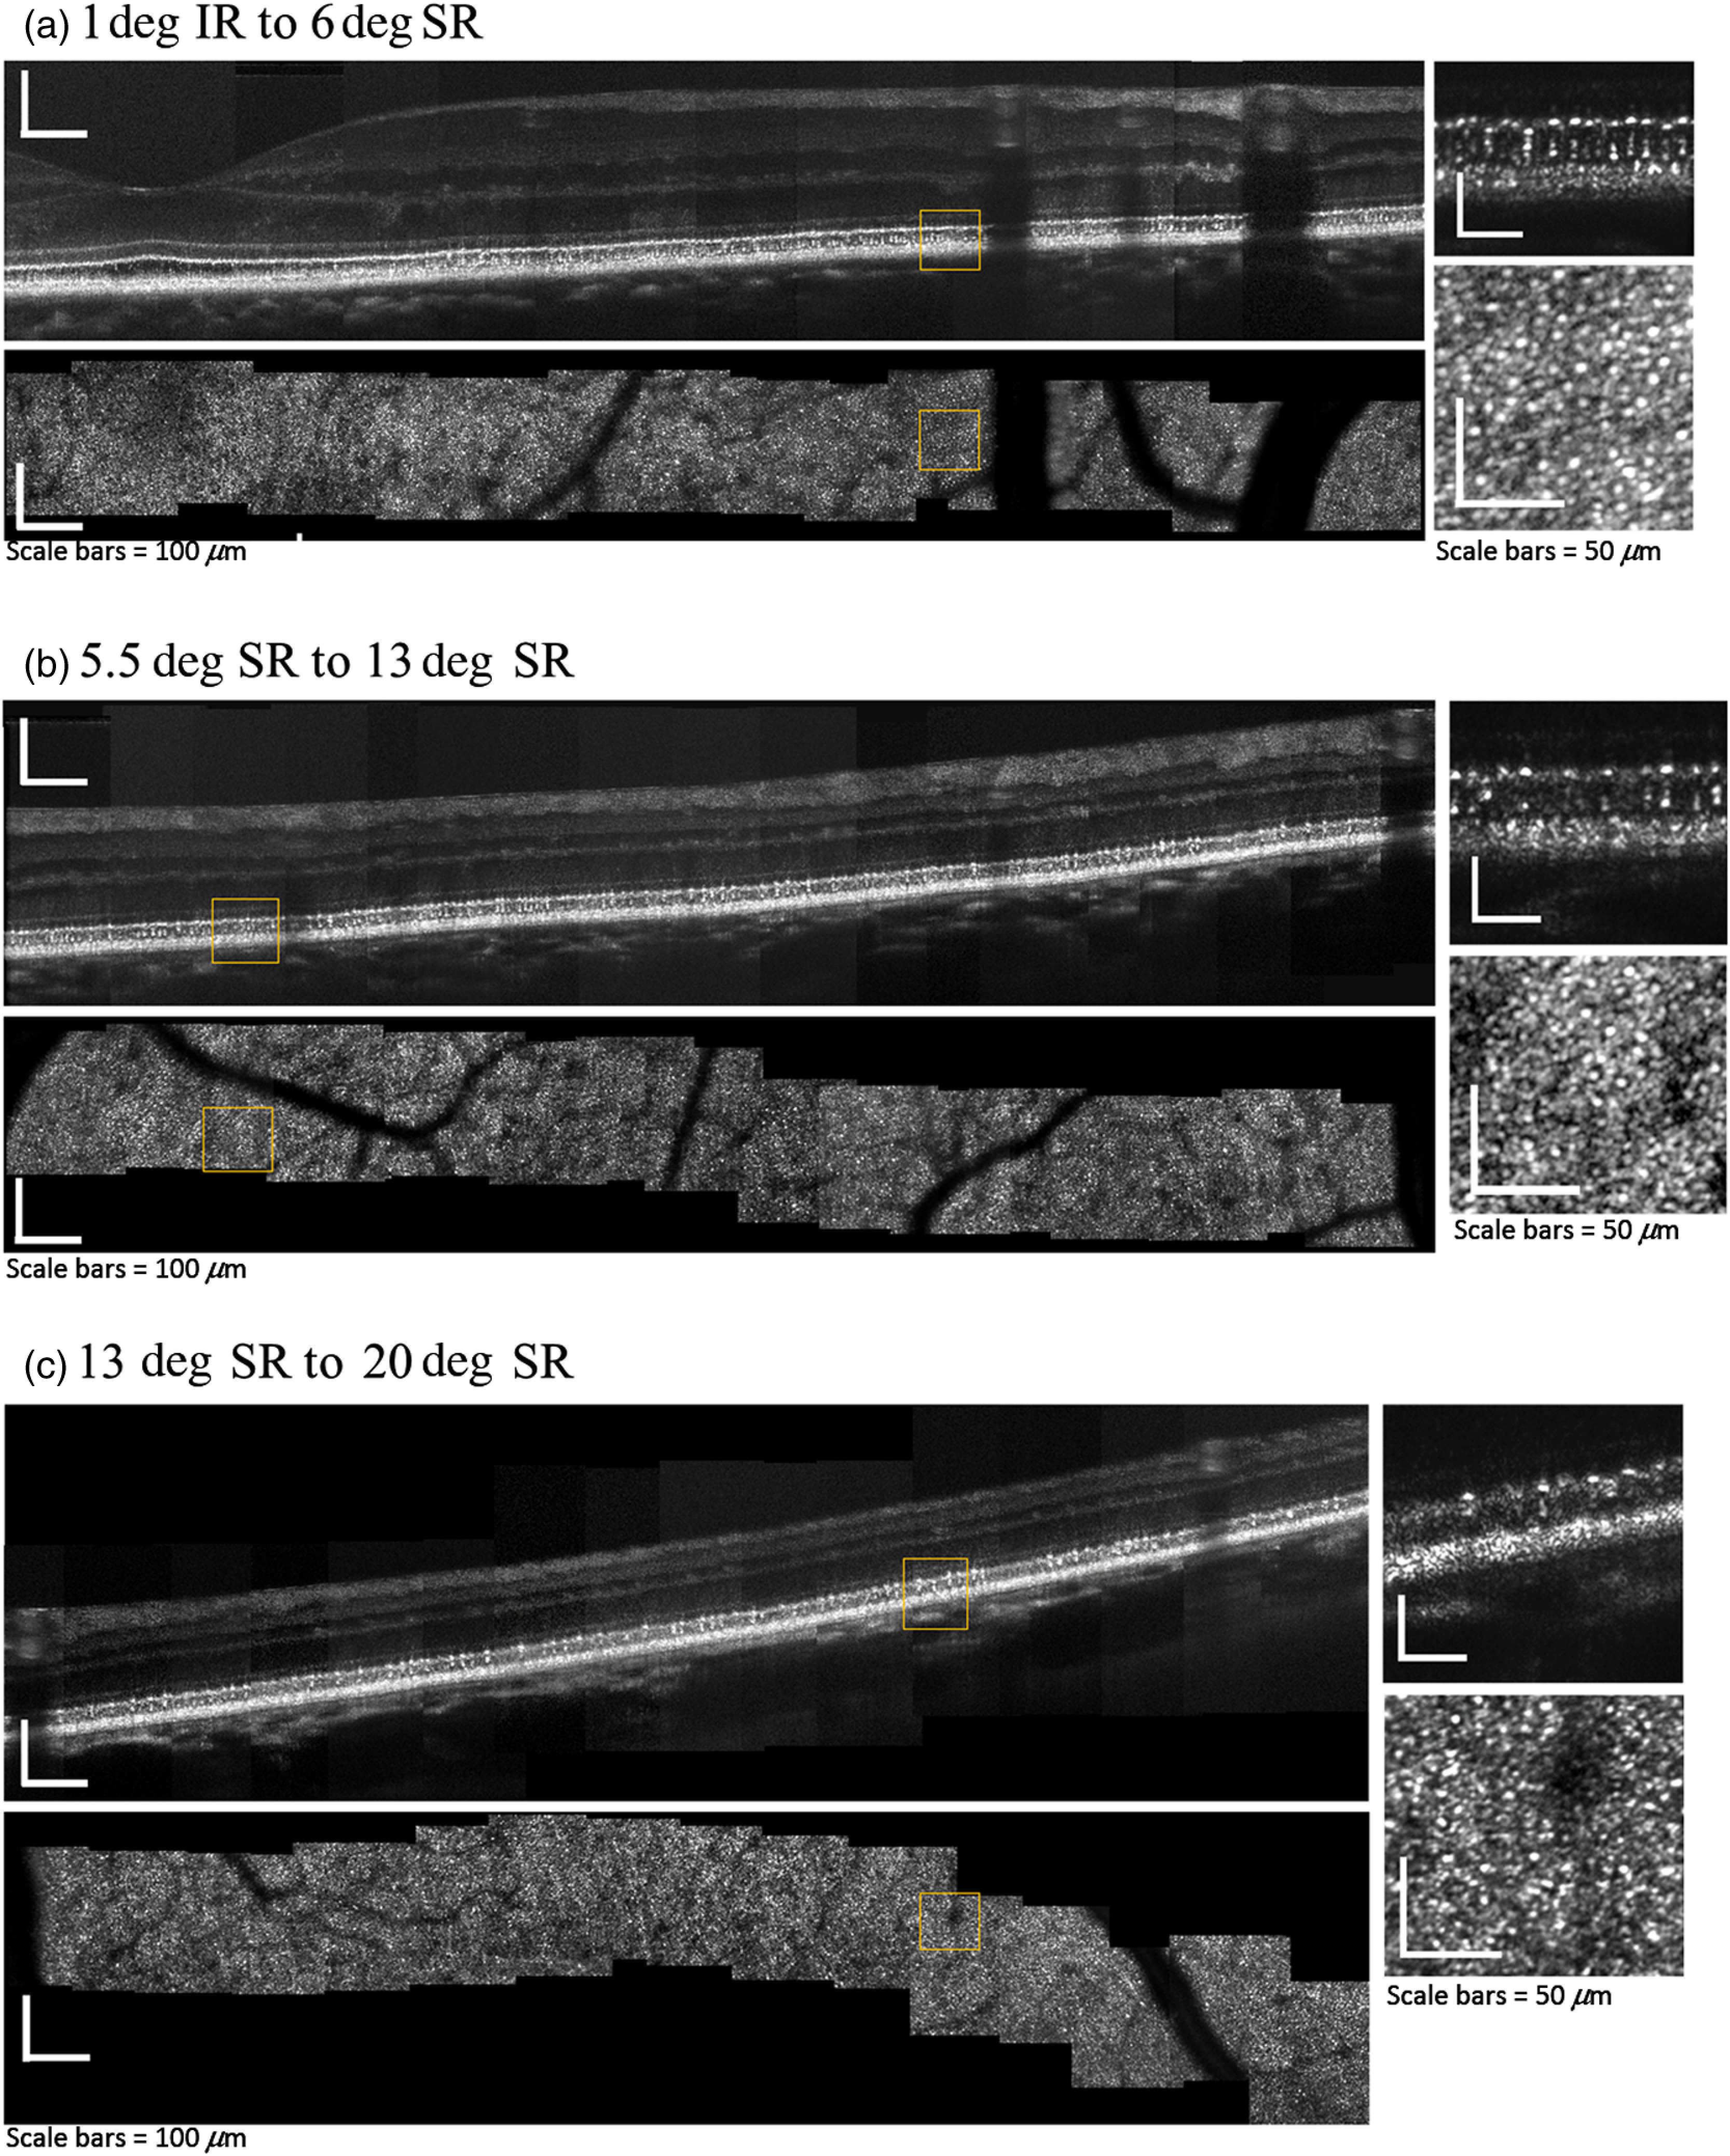
Fig. 8.

Stitched montages of AO-OCT (top) and AO-SLO (bottom) images from subject N3, ranging from (a) 1-deg IR to 6-deg SR; (b) 5.5-deg SR to 13-deg SR; and (c) 13-deg SR to 20-deg SR. Yellow boxes indicate locations of the zoomed-in regions shown on the right and are located at (a) 4-deg SR, (b) 7-deg SR, and (c) 18-deg SR. OCT images are displayed with logarithmic intensity scaling for the main stitched images, and linearly for the insets. All SLO images are displayed linearly. Scale bars for the montages are 100 and for the expanded regions.
