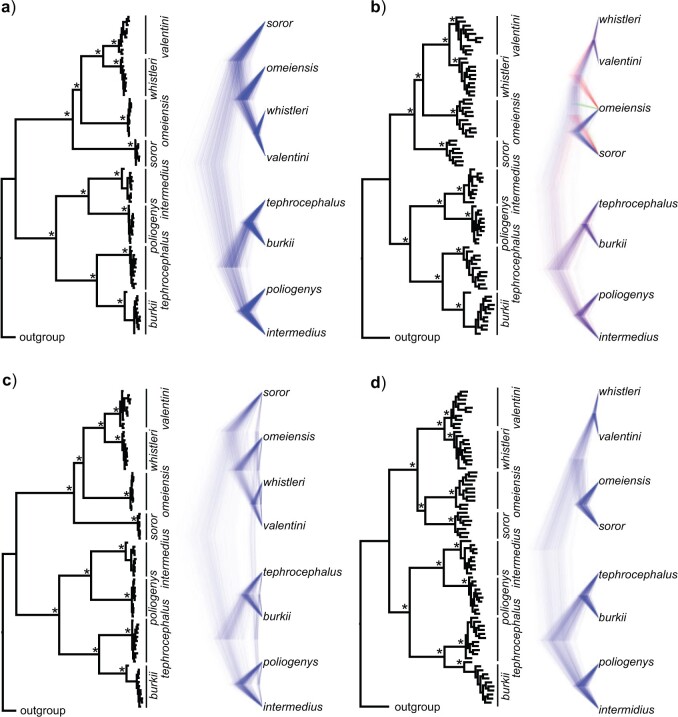
Figure 5.
Phylogenetic trees on the basis of hypotheses H1 and H2 (see Fig. 2) using sequence windows with different D-statistic values. a) ML and species trees generated from 190 sequence windows with top 0.5% D values based on the tree topology of tree1; b) ML and species trees generated from 176 windows with absolute D values  0.01 based on the tree topology of tree1; c) ML and species trees generated from 196 windows with top 0.5% D values based on the tree topology of tree2; (d) ML and species trees generated from 259 sequence windows with absolute D values
  0.01 based on the tree topology of tree2. Each pair of trees in a–d shows ML trees generated by RAxML on the left, with asterisks representing 100% bootstrap support, and species trees generated by SNAPP with blue, red and green indicating majority to minority trees, respectively. All nodes of the species trees in (a), (c), and (d) are supported by posterior probability (PP) 1.00, whereas all nodes of the species trees in (b) are supported by PP 1.00 except for soror
  omeiensis (PP
  ), omeiensis
  whistleri/valentini (PP
  ), and soror
  whistleri/valentini (PP
  ).
).

