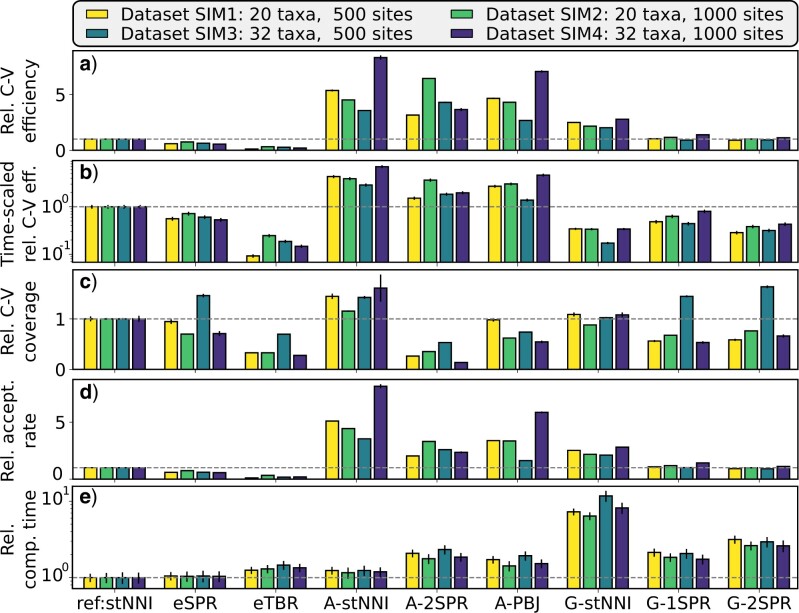
Figure 7.
Relative performance improvements of proposals on four simulated data sets using the stNNI proposal as reference. a) and b) The relative C-V efficiency for each proposal without and with penalization for their computational costs, respectively. c) and d) The relative increase in C-V coverage and acceptance rate, respectively. e) The relative computational time for the whole MCMC iteration (proposal and likelihood computational time). Absolute values are available in Figures S11–S15 of the Supplementary material available on Dryad.

