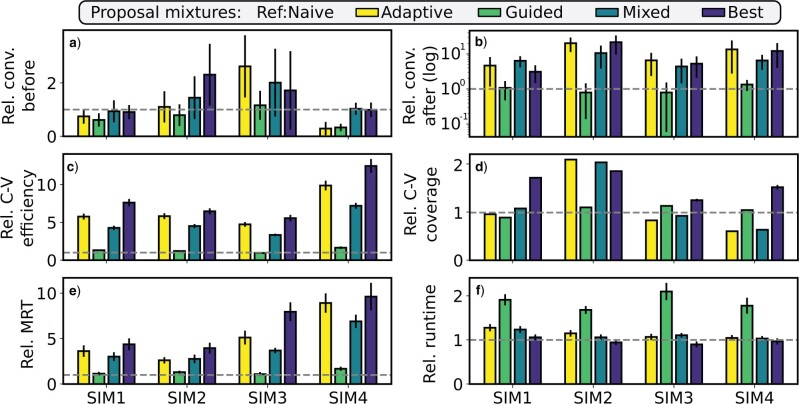
Figure 8.
Relative performance gains of proposal mixtures on four simulated data sets (i.e., SIM1 to SIM4) using the naive mixture as reference. a) and b) The acceleration in convergence time before and after removal of the burnin phase, respectively. Convergence thresholds were fixed to a 2% and 1% average error per split. c–f) Increases in C-V efficiency, C-V coverage, MRT, and overall runtime, respectively. a), b), c) and e) are weighted by the relative runtime of f). Absolute values are available in Figure S16 of the Supplementary material available on Dryad.

