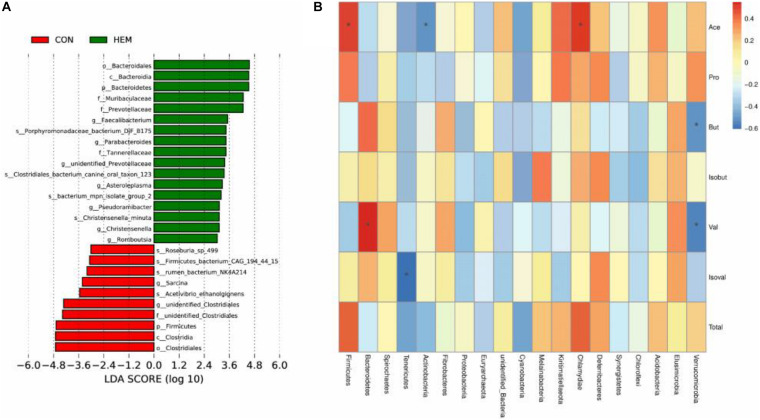
FIGURE 5.
Linear discriminant analysis coupled with effect size measurements (LEfSe) analysis for the enriched microbiota (A) and correlations between the bacteria in the phylum and the concentrations of SCFAs in the colon (B). CON (n = 9), basal diet; HEM (n = 9), basal diet supplemented with 1,000 mg/kg herbal extract mixture. *p < 0.05.

