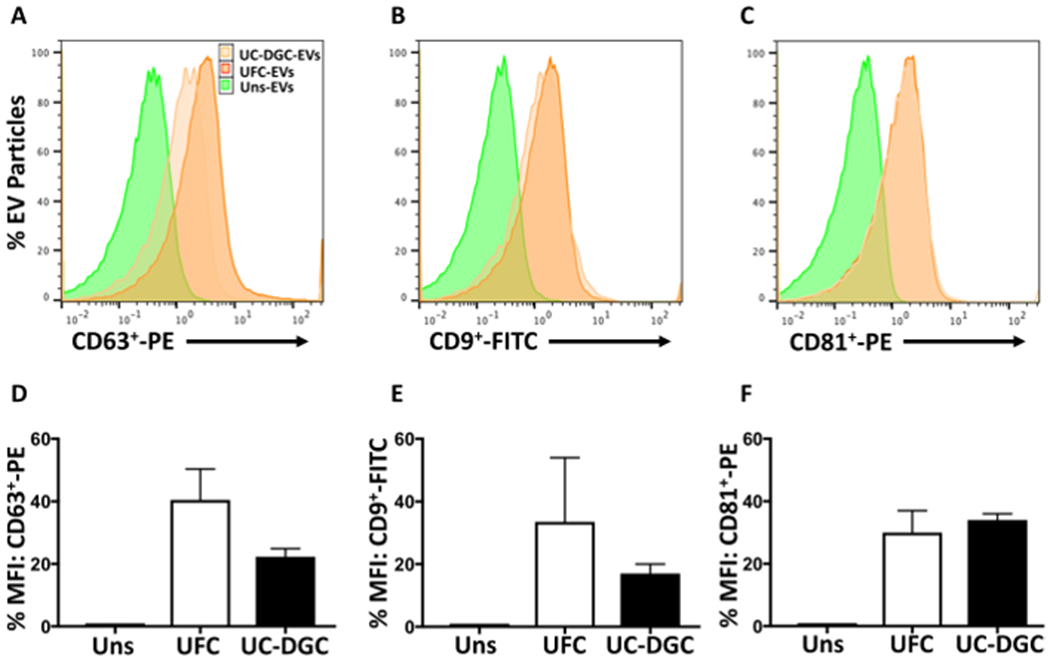
Figure 3: Ultrafiltration centrifugation-isolated murine bronchoalveolar lavage fluid-derived EVs expressed a similar fluorescent density of tetraspanin proteins to ultracentrifugation-isolated EVs.

(A and D) Histogram and geometric mean expression (gMFI) of PE-CD63+-stained EVs. (B and E) Histogram and gMFI of FITC-CD9+-stained EVs. (C and F) Histogram and gMFI of PE-CD81+-stained EVs. These data are derived from three independent experiments. UFC: ultrafiltration centrifugation; UC-DGC = ultracentrifugation with density gradient centrifugation; EVs: extracellular vesicles; SSC-A: side scatter analysis; PE: phycoerythrin; FITC: fluorescein isothiocyanate. Please click here to view a larger version of this figure.
