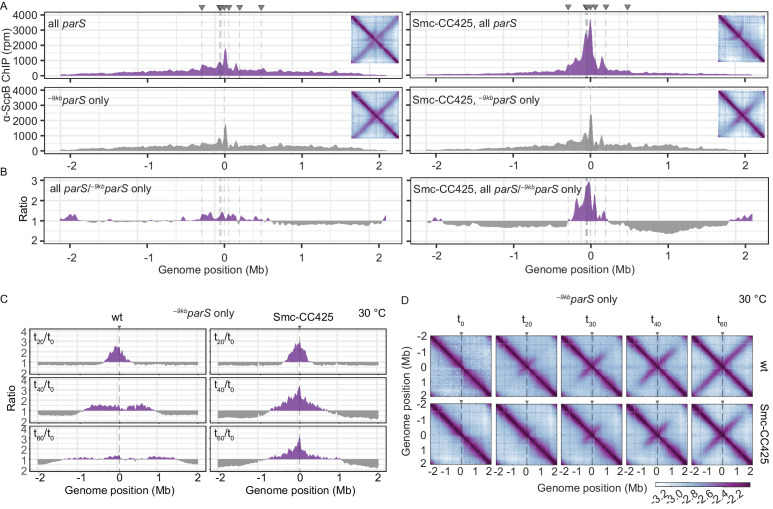
Figure 2. Modified Smc proteins hyper-accumulate in the replication origin region.
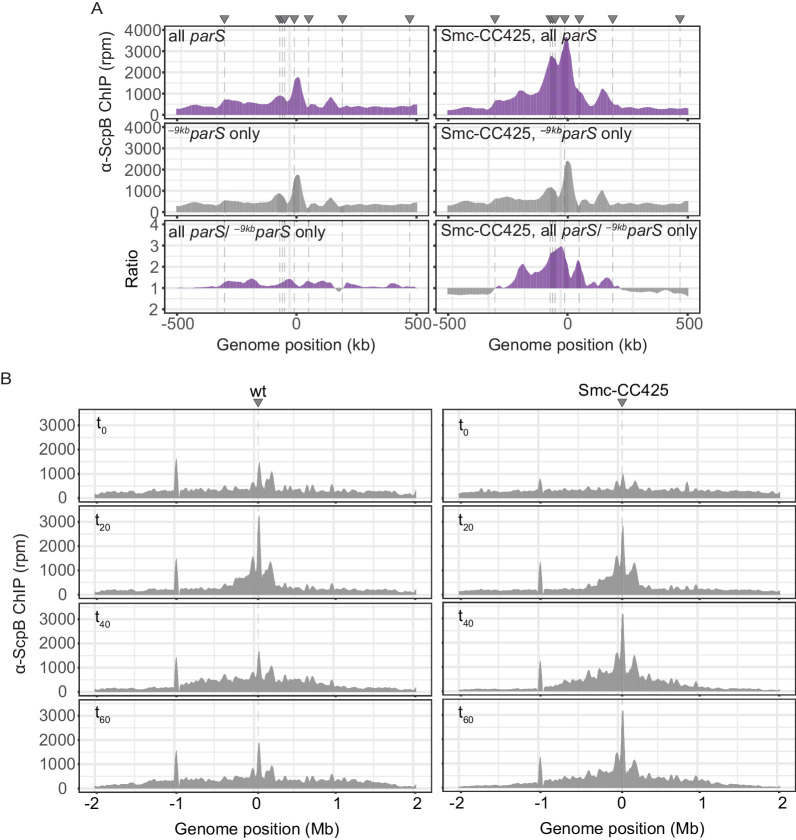
(A) Read count distribution for chromatin immunoprecipitation coupled to deep sequencing (ChIP-seq) using α-ScpB serum. Left panel: strains carrying wild-type Smc with wild-type parS sites (top) or single –9kbparSopt (parS-359) site (bottom). Removal of parS sites results in a slightly reduced enrichment in the origin region and in turn modestly increased signal mainly on the right arm of the chromosome (supposedly due to the presence of the weak +1058kbparS site; parS-90). Right panel: strains carrying Smc with elongated coiled coil (Smc-CC425) with wild-type parS sites (top) or single –9kbparSopt (parS-359) site (bottom). Insets depict corresponding 3C-seq contact maps. All ChIP-seq profiles presented in this study are divided into 1 kb bins and have the replication origin placed in the middle. Dashed lines indicate the position of parS sites. (B) Ratio plots of ChIP-seq read counts for wild-type and elongated Smc (Smc-CC425) shown in (A). For each bin, normalized read counts for single –9kbparSopt were compared with respective wild-type parS values. If the mutant/wild-type ratio was > 1, it was plotted above the genome position axis (in violet colors). If the mutant/wild-type ratio was < 1, the inverse ratio was plotted below the axis (in gray colors). (C) ChIP-seq time-course experiments using α-ScpB serum for strains carrying wild-type (left panel) or elongated Smc (Smc-CC425, right panel). These strains harbor a single loading site, -9kbparSopt (parS-359), and a theophylline-inducible parB gene. Ratios plots of read counts for a given time point (tx) versus t0 are shown. For each bin, normalized read counts were compared with respective t0 value and the higher value was divided by the lower. If the ratio tx/t0 was > 1, it was plotted above the genome position axis (in violet colors). If the ratio t0/tx was > 1, the inverse ratio was plotted below the axis (in gray colors). (D) Normalized 3C-seq contact maps for the time course experiments with strains carrying wild-type (top panel) or elongated Smc (Smc-CC425, bottom panel), corresponding to (C).


