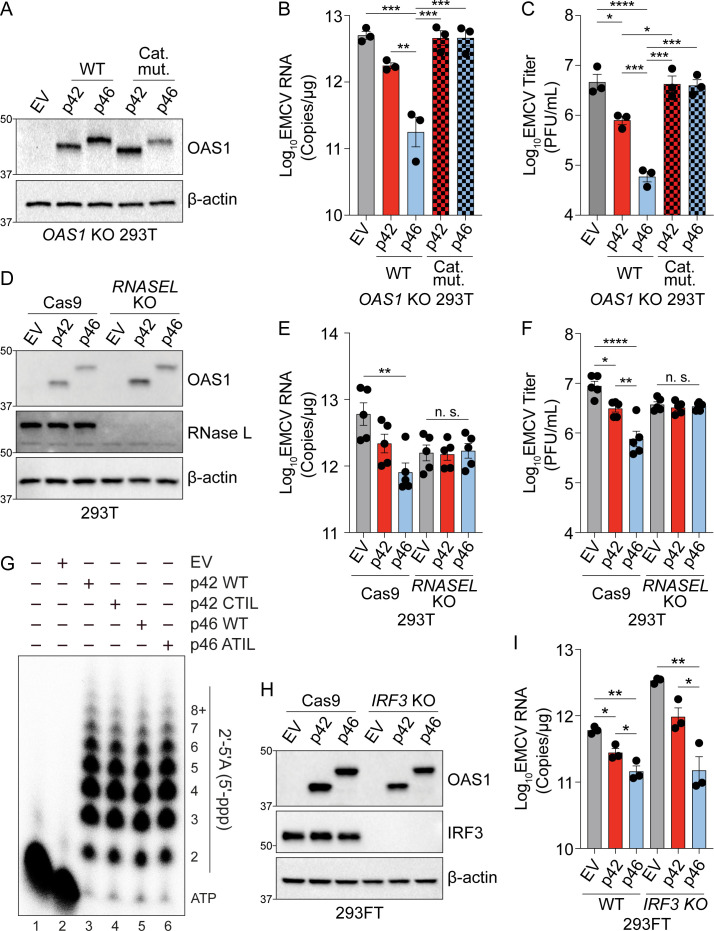
Figure 3. OAS1 isoforms require catalytic and RNase L activity.
(A) Expression of OAS1 p42 and p46 along with their corresponding catalytic mutants (250 ng) at 24 hr post transfection in OAS1 KO 293 T cells. (B) Quantification of EMCV 5′UTR by RT-qPCR in OAS1 KO 293 T cells expressing a control EV, p42, p46, or their corresponding catalytic mutants (250 ng) at 24 hr post EMCV infection (MOI=0.001). (C) Viral titers at 24 hr post EMCV infection (MOI=0.001) taken from OAS1 KO 293 T cells transfected with a control EV, p42, p46, or their corresponding catalytic mutants. (D) Immunoblot analysis of OAS1 and RNase L at 24 hr post transfection in Cas9 or RNASEL KO 293 T cells. (E) Quantification of EMCV 5′UTR by RT-qPCR in Cas9 and RNASEL KO 293 T cells expressing a control EV, p42, or p46 at 24 hr post EMCV infection (MOI=0.001). (F) Viral titers at 24 hr post-infection with EMCV (MOI=0.001) taken from Cas9 or RNASEL KO 293 T cells transfected with control EV, p42, or p46. (G) In vitro 2′−5′A synthesis assay of OAS1 p42 and p46 isoforms and their CaaX motif mutants; a representative blot of two independently performed experiments is depicted. (H) Immunoblot analysis of OAS1 and IRF3 in WT or IRF3 KO 293FT cells at 24 hr post transfection. (I) Quantification of EMCV 5′UTR 24 hr post EMCV infection (MOI=0.001) in WT or IRF3 KO 293FT cells transfected with a control EV, p42, or p46. (B, C, E, F) and (I) each data point represents an independently performed experiment. Data were analyzed using one-way ANOVA with Tukey’s multiple comparisons test where *p<0.05, **p<0.01, ***p<0.001, ****p<0.0001. (A, D) and (H) Representative immunoblots of three (A, H) and five (D) independent experiments are shown.


