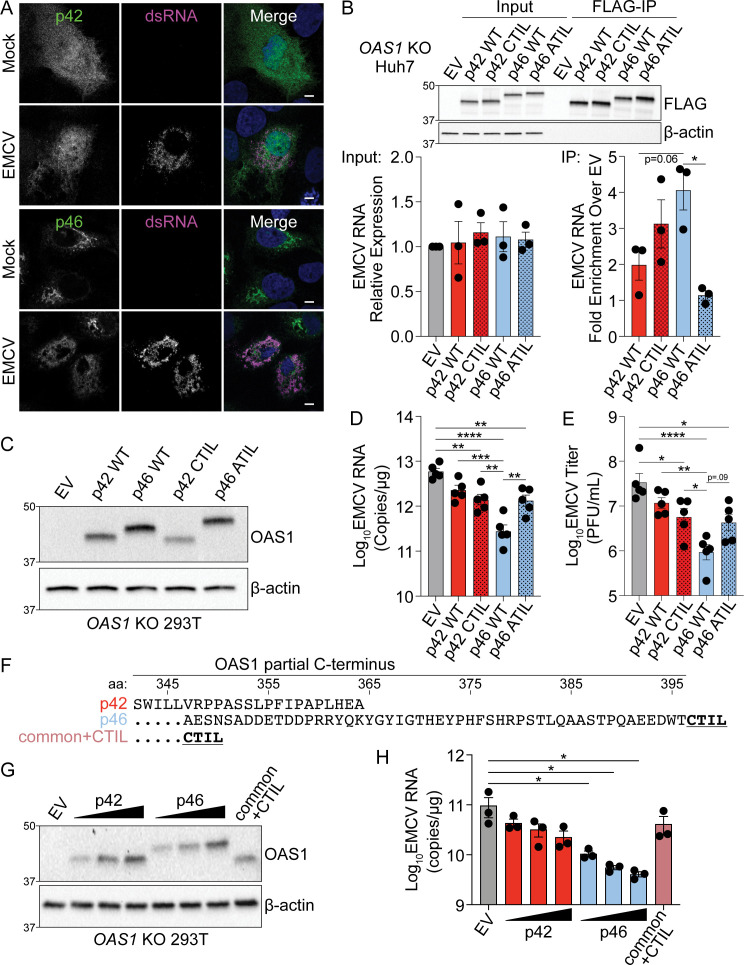
Figure 4. Endomembrane targeting of OAS1 p46 through the CaaX motif enhances access to viral RNA.
(A) Confocal micrographs from mock or EMCV infected (MOI=0.001, 12 hr) OAS1 KO Huh7 cells ectopically expressing p42 or p46 and stained with anti-OAS1 (green) and anti-dsRNA (magenta) antibodies and DAPI (blue); representative cells from one out of two independently performed experiments are depicted. (B) Immunoblot of FLAG immunoprecipitation performed on OAS1 KO Huh7 cells expressing control EV, FLAG-p42, FLAG-p42CTIL, FLAG-p46, and FLAG-p46ATIL. Quantification of EMCV 5′UTR via RT-qPCR in the input or after RNA immunoprecipitation performed on OAS1 KO Huh7 cells transfected with control EV, FLAG-p42, FLAG-p42CTIL, FLAG-p46, and FLAG-p46ATIL infected with EMCV (MOI=0.001, 12 hr). (C) Immunoblot analysis of p42, p46, p42CTIL, and p46ATIL in OAS1 KO 293 T cells at 24 hr post transfection. (D) Quantification of EMCV 5′UTR by RT-qPCR from OAS1 KO 293T expressing a control EV, p42, p46, p42CTIL, or p46ATIL at 24 hr post EMCV infection (MOI=0.001). (E) Viral titers quantified at 24 hr post-infection with EMCV at an MOI of 0.001 in OAS1 KO 293 T cells transfected with control EV, p42, p46, p42CTIL, or p46ATIL. (F) Alignment of C-termini of expression constructs used in (G) and (H). (G) Immunoblot analysis of p42 (50 ng, 100 ng, 200 ng), p46 (50 ng, 100 ng, 200 ng) and common +CTIL (500 ng) in OAS1 KO 293 T cells at 24 hr post transfection. (H) Quantification of EMCV 5′UTR by RT-qPCR from OAS1 KO 293 T cells transfected as in (G) at 24 hr post EMCV infection (MOI=0.001). Scale = 5 μm. (B, D), and (E) Data were analyzed using one-way ANOVA with Tukey’s multiple comparisons test where *p<0.05, **p<0.01, ***p<0.001, ****p<000.1. (H) Data were analyzed using a one-way ANOVA with Dunnett’s multiple comparisons test (vs. EV) where *p<0.05. (B, C) and (G) Representative immunoblots of three (B, G) and five (C) independent experiments are shown. (B, D) and (H) Each data point represents an independently performed experiment.
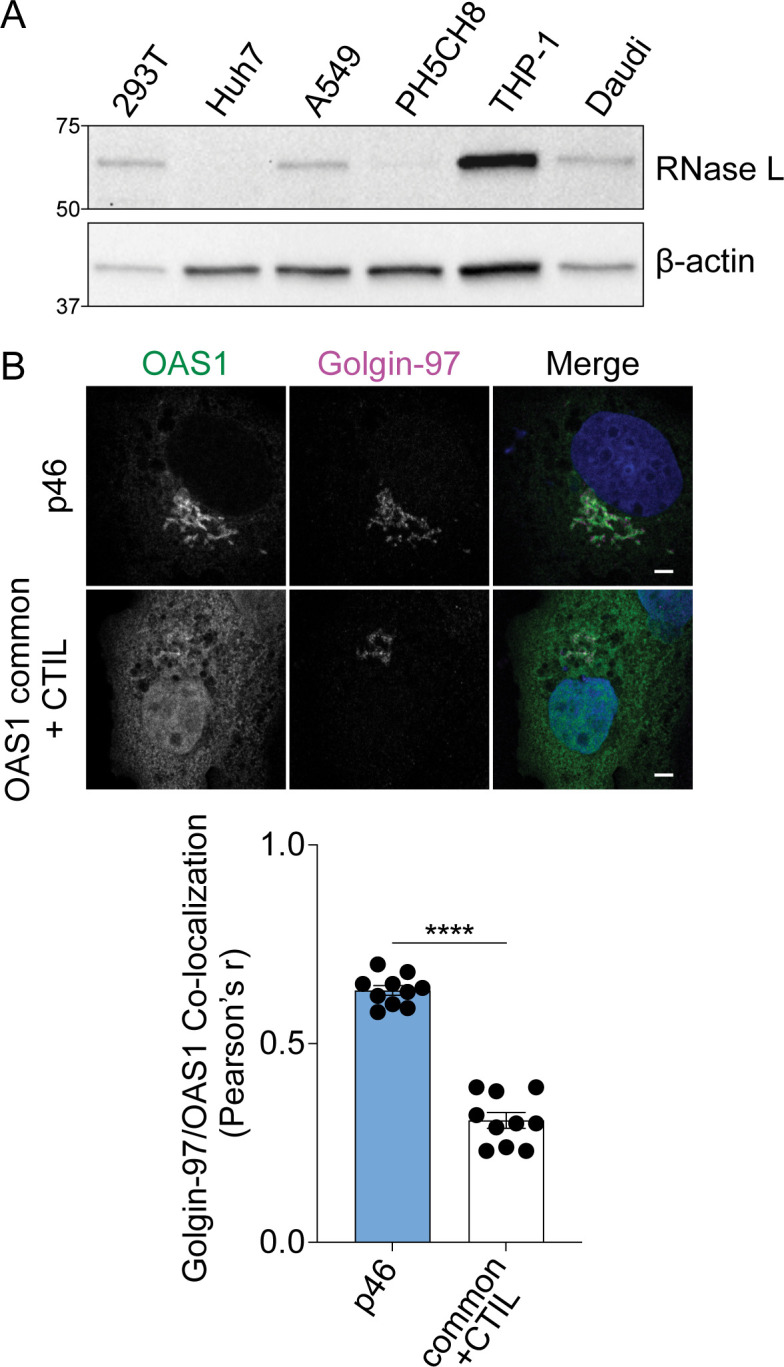
Figure 4—figure supplement 1. Role of CaaX motif in OAS1 localization.


