. 2021 Aug 3;10:e71047. doi: 10.7554/eLife.71047

Figure 6. OAS1 p46 has broad antiviral activity against viruses that use the endomembrane system for replication.

(A) WNV Texas titers (percent titer normalized to EV) 48 hr post WNV infection (MOI=0.001) taken from OAS1 KO 293 T cells transfected with control EV, p42, and p46. (B) Representative confocal micrographs from mock or WNV Texas (MOI=1, 24 hr) infected OAS1 KO 293 T cells expressing p42 or p46 and stained with DAPI (blue) and anti-OAS1 (green), PDIA3 (red), and dsRNA (magenta) antibodies; scale = 5 μm. (C, D) Pearson’s correlation of OAS1 and (C) PDIA3 and (D) dsRNA; each data point represents an individual cell of one representative experiment. (E) CVB3 titers (percent titer normalized to EV) 48 hr post CVB3 infection (MOI=0.001) in OAS1 KO 293 T cells transfected with a control EV, p42, or p46. (F) SARS-CoV-2 titers taken at 48 hr post-infection (MOI=0.1) from ACE2 293 T cells expressing EV, p42, p46, or p46ATIL for 24 hr. (G) OAS1 rs10774671 genotype frequency in severe COVID-19 cohort and matched healthy control subjects. (A) (C) (E) and (F) Data were analyzed using one-way ANOVA with Tukey’s multiple comparisons test where *p<0.05, **p<0.01, ***p<0.001, ****p<000.1 (B) Representative cells from one of two independently performed experiments are depicted. (D) Data were analyzed by unpaired t test where ****p<0.0001. (A), (E) and (F) Each data point represents an independently performed experiment.

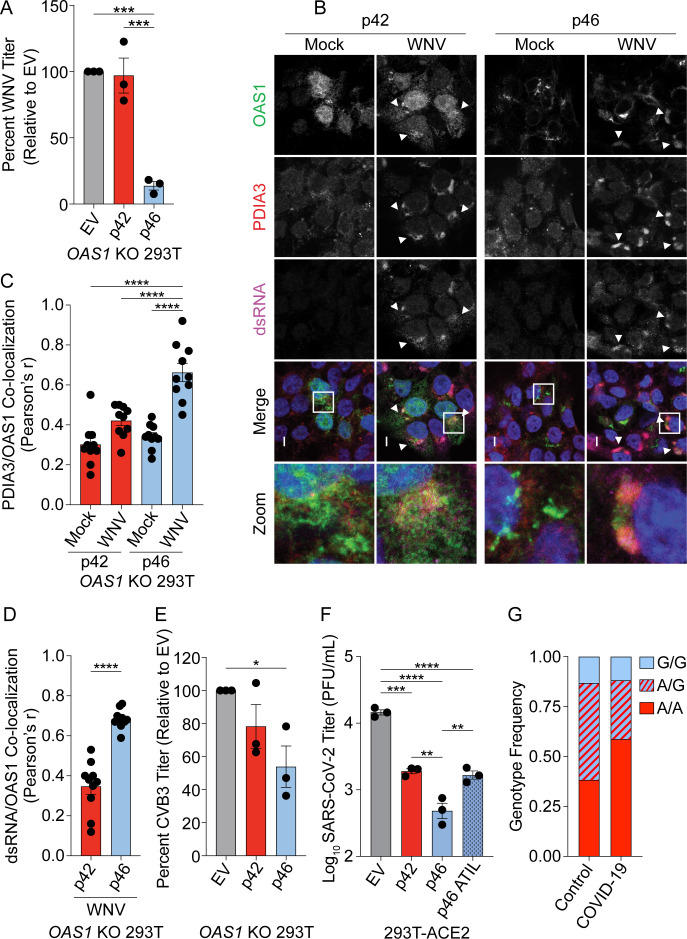
Figure 6—source data 1. Excel file with the summary statistics for the association analysis for Figure 6G.

Figure 6.

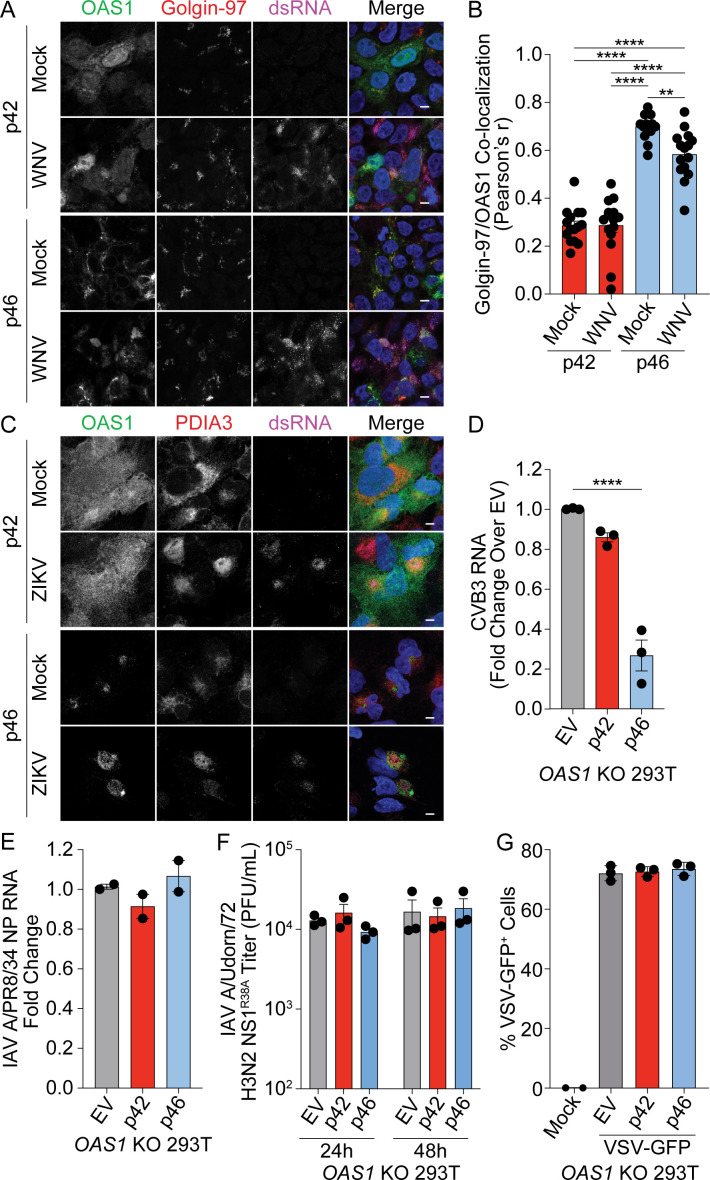
Figure 6—figure supplement 1. Endomembrane targeting of OAS1 p46 confers its enhanced antiviral activity.

Figure 6—figure supplement 1.

(A) Representative confocal micrographs from mock or WNV Texas (MOI=1, 24 hr) infected OAS1 KO 293 T cells expressing p42 or p46 and stained with DAPI (blue) and anti-OAS1 (green), Golgin-97 (red), and dsRNA (magenta) antibodies. (B) Pearson’s correlation of OAS1 and Golgin-97; each data point represents an individual cells of one experiment. (C) Representative confocal micrographs from mock or ZIKV MR766 (MOI=5, 24 hr) infected OAS1 KO A549 cells expressing p42 or p46 and stained with DAPI (blue) and anti-OAS1 (green), PDIA3 (red), and dsRNA (magenta) antibodies. (D) Relative quantification of CVB3 RNA in EV, p42, or p46 expressing OAS1 KO 293 T cells infected with CVB3 (MOI=0.001, 24 hr). (E) Relative quantification of influenza A virus A/PR/8/34 NP RNA in EV, p42, or p46 expressing OAS1 KO 293 T cells infected with IAV A/PR/8/34 (MOI=0.01, 24 hr). (F) Viral titers from OAS1 KO 293 T cells expressing EV, p42, or p46, infected with IAV A/Udorn/72 H3N2 R38A (MOI=0.01). (G) Quantification of VSV-GFP+ OAS1 KO 293 T cells expressing EV, p42, or p46 (MOI=0.1, 6 hr). Scale = 5 μm. (B, D, E, F) and (G) Data were analyzed using one-way ANOVA with Tukey’s multiple comparisons test where **p<0.01 and ****p<0.0001. (A and C) Representative cells from one experiment are depicted. (D, E, F) and (G) Each data point represents an independently performed experiment.