
Figure 4.
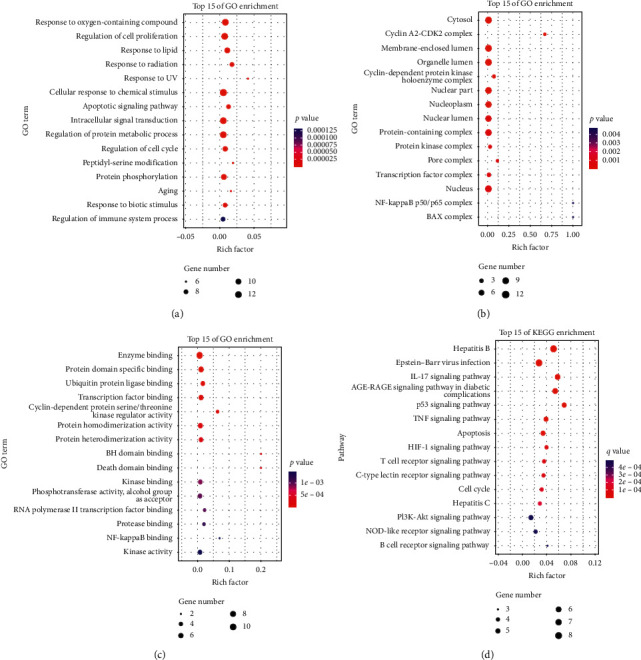
Enrichment analysis of core targets for FXF on the treatment of pulmonary fibrosis through OmicShare: (a) The top fifteen enriched GO-biological process; (b) GO-molecular functions; (c) GO-cellular components terms; and (d) KEGG pathways. The abscissa shows the enrichment factor, and the ordinate shows the GO terms or KEGG pathways. The color of the dot represents the adjusted p-value/q-value, and the size of the dot represents the number of core targets mapped to the reference GO terms or pathways.