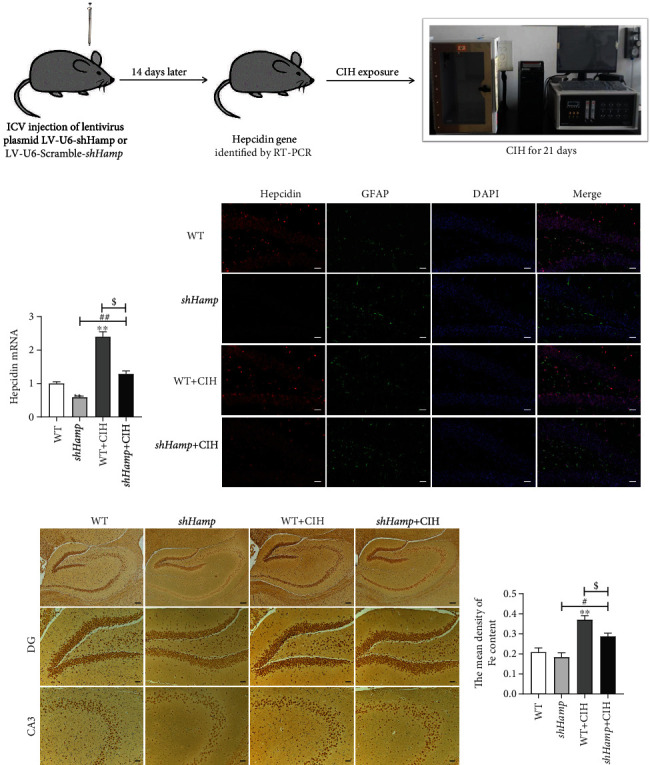
Figure 2.

The preparation and identification of shHamp mice and iron level. (a) The prepared pattern diagram of shHamp mice of astrocyte-specific knockdown hepcidin. (b) Hepcidin mRNA level determined by q-PCR in the hippocampus of WT and shHamp mice exposed to CIH for 21 days (n = 6). (c) Double immunofluorescence staining in the hippocampal dentate gyrus (DG). The sections were labeled for hepcidin (red), GFAP (green), and DAPI (blue) (scale bar = 25 μm, n = 3). (d) Perls' staining of the dentate gyrus (DG) and hippocampal CA3 (scale bar = 100 μm or 25 μm). (e) The mean density of Fe content as shown in panel (d) (n = 3). The data are shown as the means ± SEM. ∗p < 0.05 and ∗∗p < 0.01 vs. WT. #p < 0.05 vs. shHamp. $p < 0.05 vs. WT+CIH.
